The ggplot2 package has several functions to add annotation layers to the plots such as reference lines (geom_vline, geom_hline and geom_abline), segments (geom_segment), curves (geom_curve) and arrows (arrows). In this tutorial we are going to review the most common use cases of these functions.
Vertical lines with geom_vline
Considering that you have a plot made with ggplot2 you can add a new layer with geom_vline to add a single or multiple vertical lines. You just need to pass a single value or a numeric vector to the xintercept argument of the function where you want the lines to be displayed.
Note that you can also customize graphical arguments such as linetype, color or lwd.
# install.packages("ggplot2")
library(ggplot2)

# Data
set.seed(1)
df <- data.frame(x = rnorm(100),
                 y = rnorm(100))

ggplot(df, aes(x = x, y = y)) +
  geom_point() +
  geom_vline(xintercept = 0,
             linetype = 2,
             color = 2)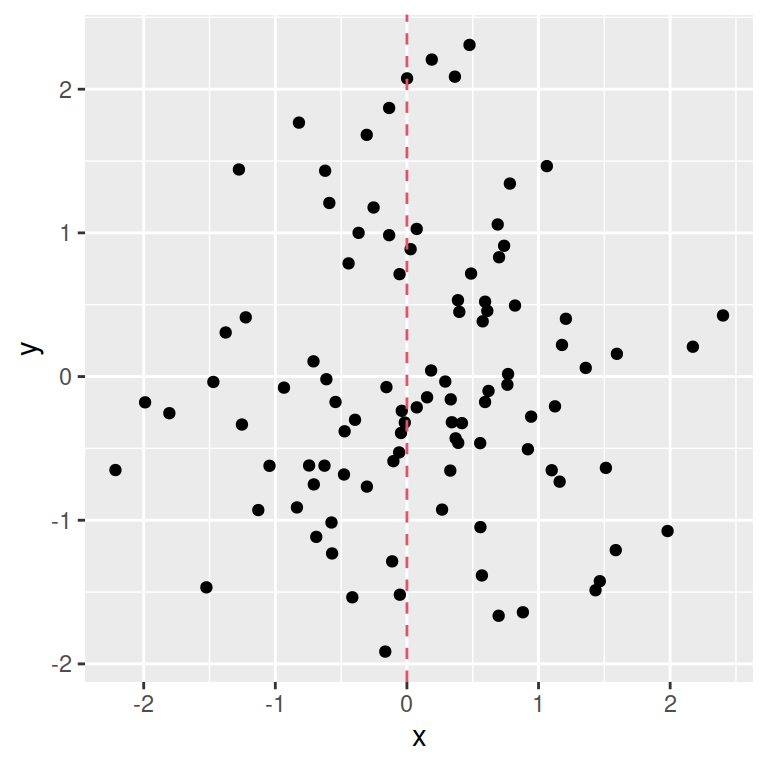
Adding several lines at once
Note that all functions of this tutorial allow doing this.
# install.packages("ggplot2")
library(ggplot2)

# Data
set.seed(1)
df <- data.frame(x = rnorm(100),
                 y = rnorm(100))

ggplot(df, aes(x = x, y = y)) +
  geom_point() +
  geom_vline(xintercept = -1:1,
             linetype = 1,
             color = 2:4)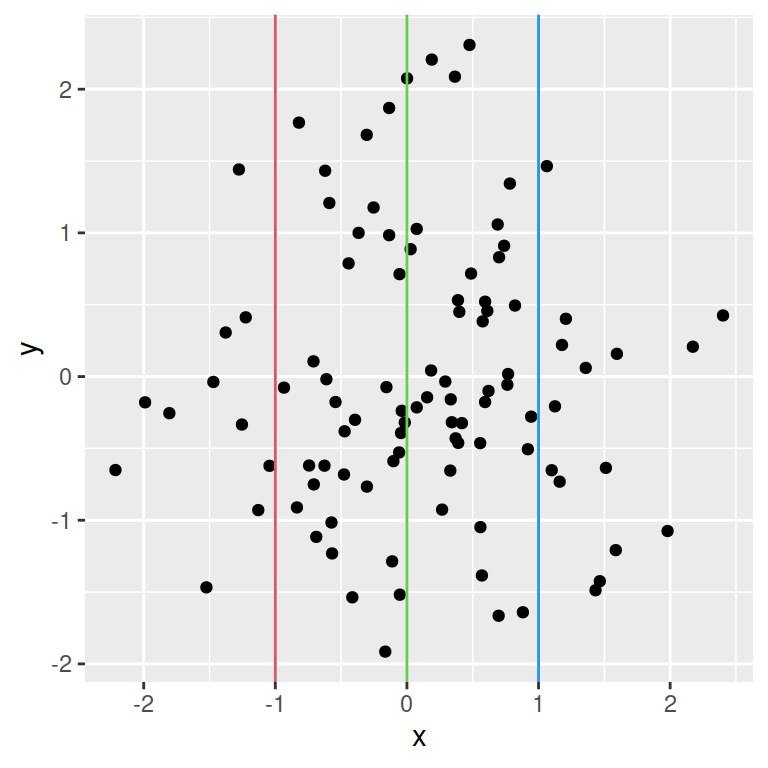
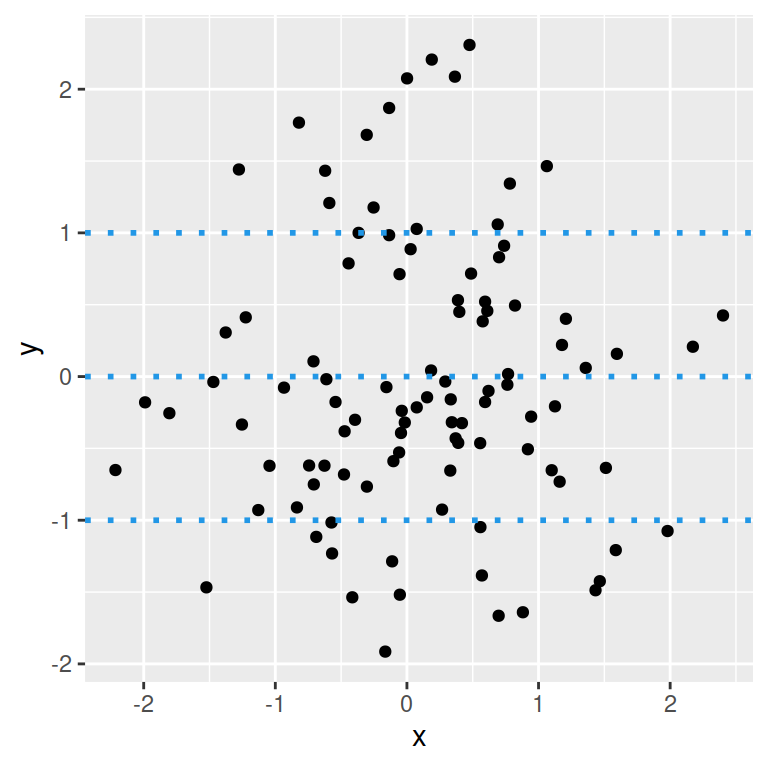
Horizontal lines with geom_hline
The geom_hline function behaves the same way as geom_vline. The only difference is that this function will add horizontal lines, so you will need to specify the yintercept argument instead of xintercept.
# install.packages("ggplot2")
library(ggplot2)

# Data
set.seed(1)
df <- data.frame(x = rnorm(100),
                 y = rnorm(100))

ggplot(df, aes(x = x, y = y)) +
  geom_point() +
  geom_hline(yintercept = -1:1,
             linetype = 3,
             color = 4,
             lwd = 1)
Diagonal lines with geom_abline
The geom_abline function allows adding diagonal lines based on a intercept and a slope. The following example shows a diagonal line with intercept 0 and slope of 1.
# install.packages("ggplot2")
library(ggplot2)

# Data
set.seed(1)
df <- data.frame(x = rnorm(100),
                 y = rnorm(100))

ggplot(df, aes(x = x, y = y)) +
  geom_point() +
  geom_abline(intercept = 0,
              slope = 1)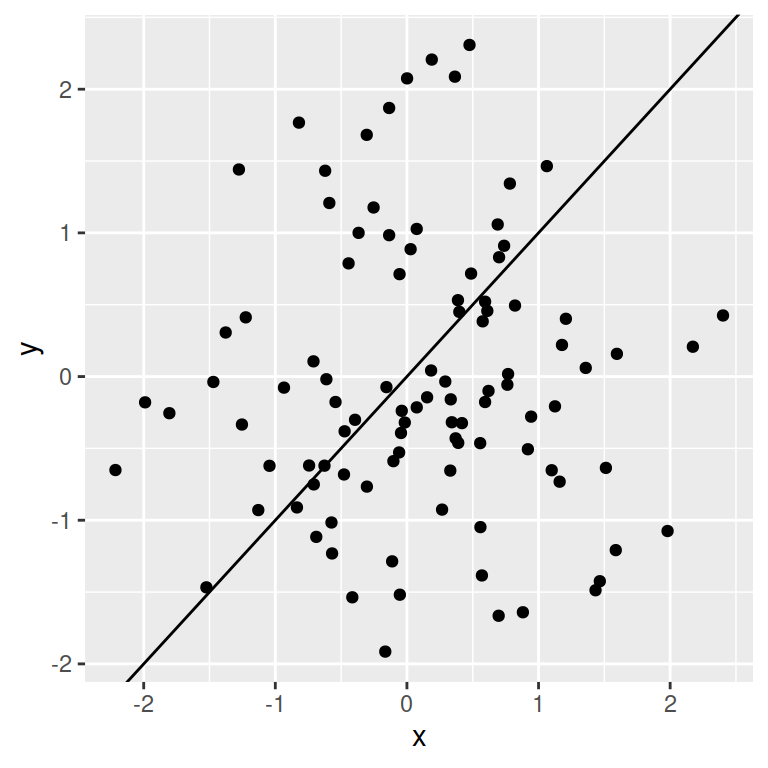
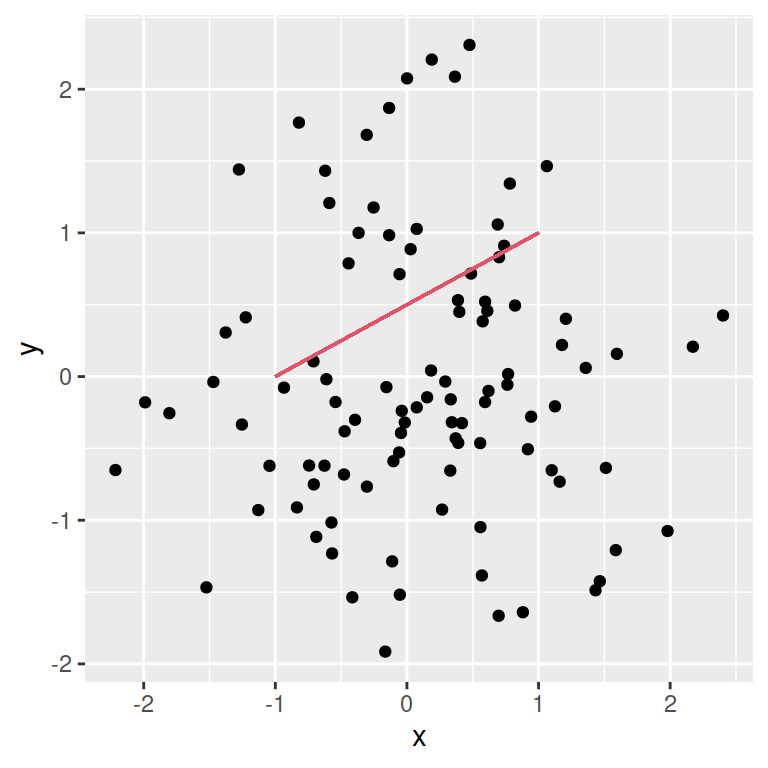
Segments with geom_segment
The previous functions can be used to add lines to the plots, but you cannot create segments with them. For that reason there exists the geom_segment function, which allows specifying the X and Y coordinates of the start and end of the desired segment with x, y (start) and xend, yend (end), respectively.
Note that if you pass the arrow function to the arrow argument you can create an arrow. See the arguments of the arrow function for further customization.
# install.packages("ggplot2")
library(ggplot2)

# Data
set.seed(1)
df <- data.frame(x = rnorm(100),
                 y = rnorm(100))

ggplot(df, aes(x = x, y = y)) +
  geom_point() +
  geom_segment(x = -1, y = 0,
               xend = 1, yend = 1,
color = 2)![]()
Annotate arrow
# install.packages("ggplot2")
library(ggplot2)

# Data
set.seed(1)
df <- data.frame(x = rnorm(100),
                 y = rnorm(100))

ggplot(df, aes(x = x, y = y)) +
  geom_point() +
  geom_segment(x = -2, y = 1,
               xend = 1, yend = -1,
               color = 2,
               arrow = arrow())
Curves with geom_curve
The geom_curve function behaves the same way as geom_segment. The only difference is that this function will create a curve instead of a straight line. You can also create an arrow using this function.
# install.packages("ggplot2")
library(ggplot2)

# Data
set.seed(1)
df <- data.frame(x = rnorm(100),
                 y = rnorm(100))

ggplot(df, aes(x = x, y = y)) +
  geom_point() +
  geom_curve(x = -2, y = 1,
             xend = 1, yend = -1,
             color = 4)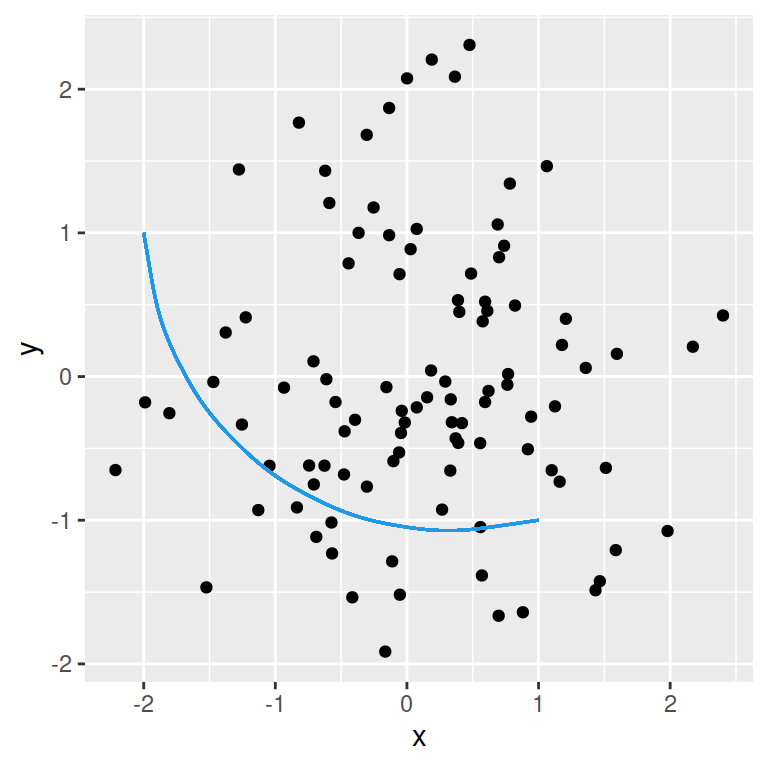
Note that you can set the level of curvature passing a value the curvature argument of the function. A zero is a straight line, negative values will produce left-handed curves and positive values produce right-handed curves.
# install.packages("ggplot2")
library(ggplot2)

# Data
set.seed(1)
df <- data.frame(x = rnorm(100),
                 y = rnorm(100))

ggplot(df, aes(x = x, y = y)) +
  geom_point() +
  geom_curve(x = -2, y = 1,
             xend = 1, yend = -1,
             color = 4,
             curvature = -0.2) # Level of curvature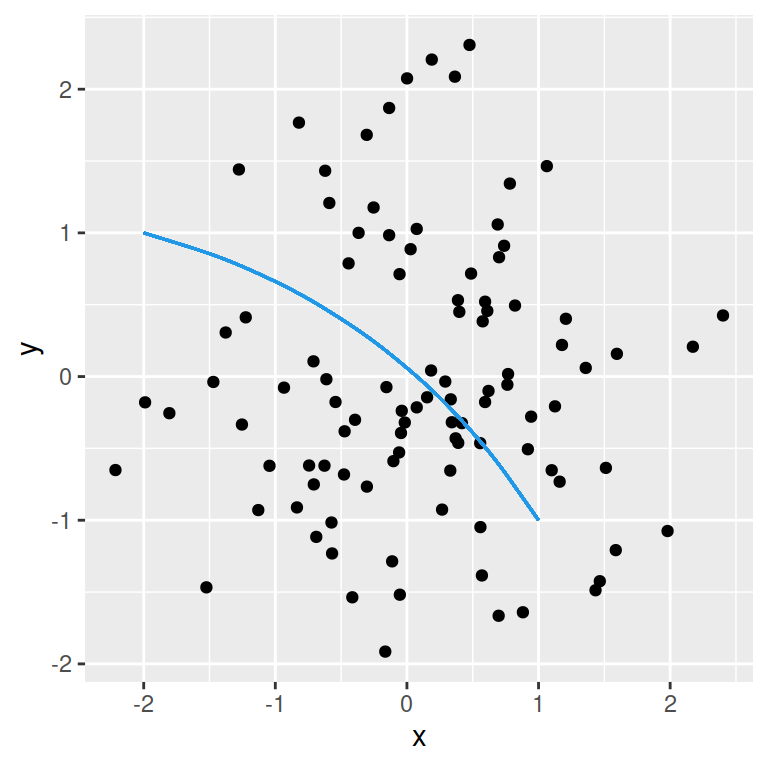
Annotate arrow
# install.packages("ggplot2")
library(ggplot2)

# Data
set.seed(1)
df <- data.frame(x = rnorm(100),
                 y = rnorm(100))

ggplot(df, aes(x = x, y = y)) +
  geom_point() +
  geom_curve(x = -2, y = 1,
             xend = 1, yend = -1,
             color = 2,
arrow = arrow())![]()

Master Statistics
Learn statistics from the basics to advanced techniques, clearly explained
Go to site