When using ggplot2 you can create multi panel plots, also known as Trellis plots or facets with the facet_grid or facet_wrap functions. These functions are similar, but there are some differences between them, as the former creates a matrix of panels based on two discrete variables (it also works with one, but its not recommended) while the latter creates a ribbon of plots based on a single discrete variable (it also works with two, but its not recommended).
One discrete variable: facet_wrap
Consider, for instance, that you have a set of observations that belong to different groups. In this scenario, you can display them in the same graph and highlight the groups with a different color or marker.
# install.packages("ggplot2")
library(ggplot2)

# Data simulation
set.seed(4)
x <- runif(500)
y <- 4 * x ^ 2 + rnorm(length(x), sd = 5)
group <- ifelse(x < 0.4, "G1", ifelse(x < 0.6, "G2", ifelse(x < 0.8, "G3", "G4")))
x <- x + runif(length(x), -0.5, 0.5)

# Data frame
df <- data.frame(x = x, y = y, group = group)

# Scatter plot by group
ggplot(df, aes(x = x, y = y, color = group)) +
  geom_point()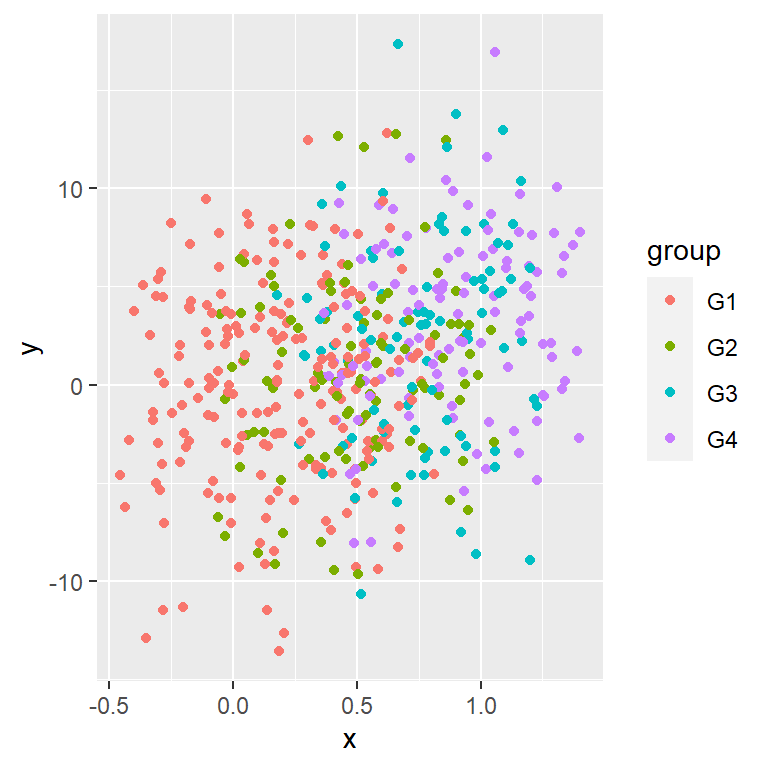
The problem is that sometimes the chart is not readable, so an alternative is to split the data into different plots to see each group individually. For this purpose you can make use of the facet_wrap function passing the grouping variable as formula, e.g. ~group.
# install.packages("ggplot2")
library(ggplot2)

# Data simulation
set.seed(4)
x <- runif(500)
y <- 4 * x ^ 2 + rnorm(length(x), sd = 5)
group <- ifelse(x < 0.4, "G1", ifelse(x < 0.6, "G2", ifelse(x < 0.8, "G3", "G4")))
x <- x + runif(length(x), -0.5, 0.5)

# Data frame
df <- data.frame(x = x, y = y, group = group)

# Ribbon of plots
ggplot(df, aes(x = x, y = y, color = group)) +
  geom_point(show.legend = FALSE) +
  facet_wrap(~group)
Change the order of the panels ordering the levels of the categorical variable with factor.
Number of rows and columns
The default number of rows and columns will depend on your data. If your categorical variable has four groups the facet_wrap function will create two columns and two rows, but in this example maybe having only one row is more readable, so you can set nrow = 1 or ncol = 4.
# install.packages("ggplot2")
library(ggplot2)

# Data simulation
set.seed(4)
x <- runif(500)
y <- 4 * x ^ 2 + rnorm(length(x), sd = 5)
group <- ifelse(x < 0.4, "G1", ifelse(x < 0.6, "G2", ifelse(x < 0.8, "G3", "G4")))
x <- x + runif(length(x), -0.5, 0.5)

# Data frame
df <- data.frame(x = x, y = y, group = group)

# Ribbon of plots (2 columns)
ggplot(df, aes(x = x, y = y, color = group)) +
  geom_point(show.legend = FALSE) +
  facet_wrap(~group, nrow = 1) # Or ncol= 4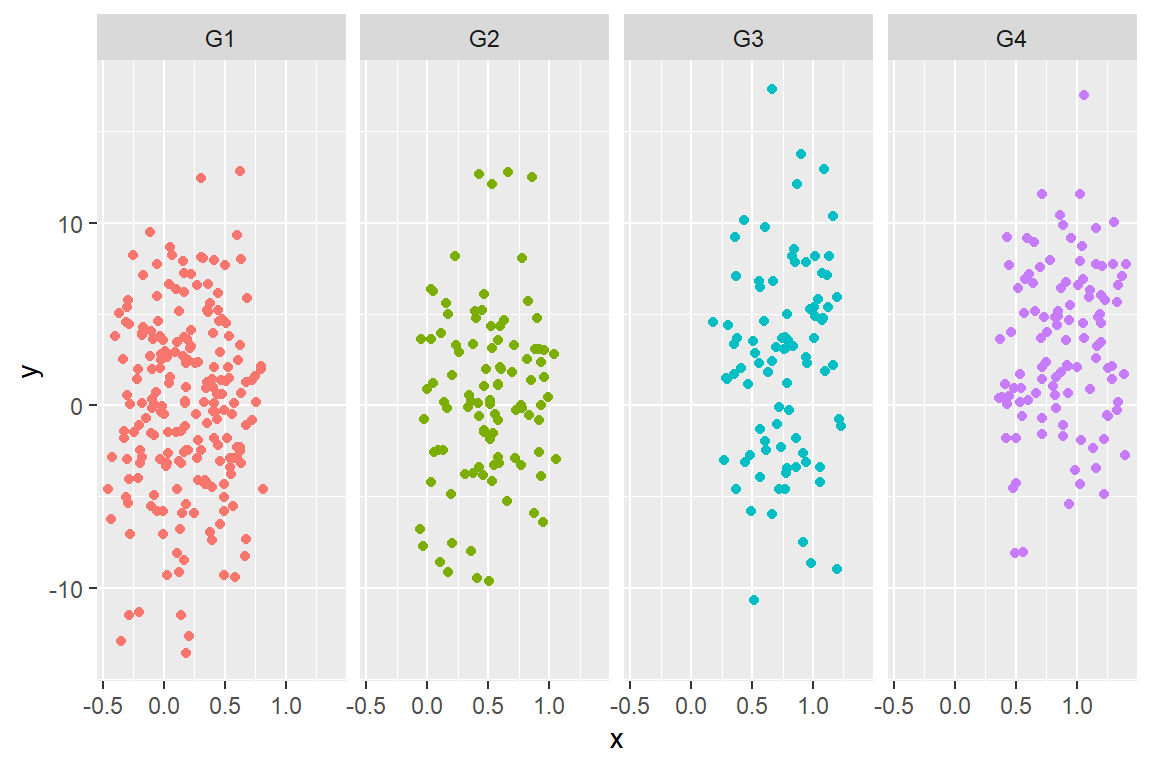
If instead of facet_wrap we use facet_grid, the same panels will be created, but there would always be only one row or only one column. That’s why its use its not recommended and is better to use facet_wrap and be able to choose the number of rows or columns.
Axis scales
By default, all the panels will have the same scale along the axis, but when the data is in different scale you can set scales = "free", so each plot will have a different range. Setting the scales free makes easier to see patterns on each panel, while fixed makes easier to find patterns across panels. Note that you can also free a single axis with scales = "free_x" or scales = "free_y".
# install.packages("ggplot2")
library(ggplot2)

# Data simulation
set.seed(4)
x <- runif(500)
y <- 4 * x ^ 2 + rnorm(length(x), sd = 5)
group <- ifelse(x < 0.4, "G1", ifelse(x < 0.6, "G2", ifelse(x < 0.8, "G3", "G4")))
x <- x + runif(length(x), -0.5, 0.5)

# Data frame
df <- data.frame(x = x, y = y, group = group)

# Ribbon of plots
ggplot(df, aes(x = x, y = y, color = group)) +
  geom_point(show.legend = FALSE) +
  facet_wrap(~group, scales = "free")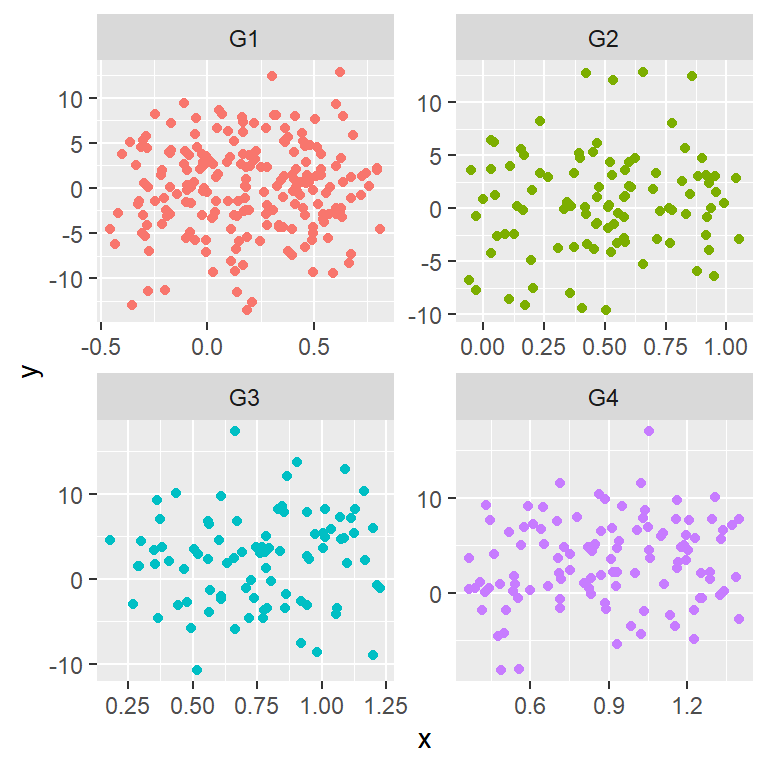
Panels direction
The default direction for the panels is horizontal (dir = "h") but you can also set it to vertical with dir = "v". See that the upper right panel now corresponds to the third groups instead to the second.
# install.packages("ggplot2")
library(ggplot2)

# Data simulation
set.seed(4)
x <- runif(500)
y <- 4 * x ^ 2 + rnorm(length(x), sd = 5)
group <- ifelse(x < 0.4, "G1", ifelse(x < 0.6, "G2", ifelse(x < 0.8, "G3", "G4")))
x <- x + runif(length(x), -0.5, 0.5)

# Data frame
df <- data.frame(x = x, y = y, group = group)

# Vertical ribbon of plots
ggplot(df, aes(x = x, y = y, color = group)) +
  geom_point(show.legend = FALSE) +
  facet_wrap(~group, dir = "v")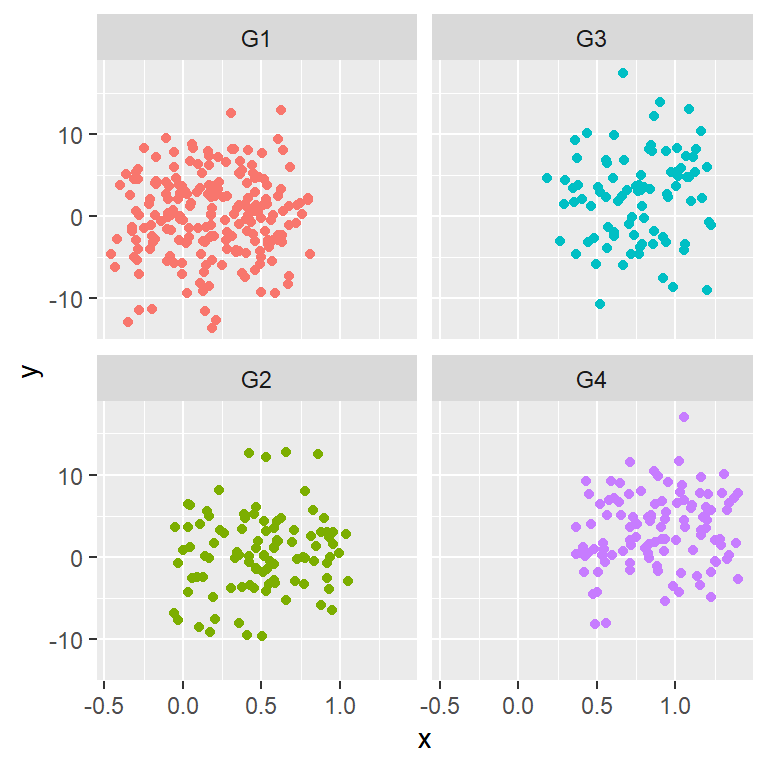
Labels position
The facet_wrap function provides an argument named strip.position that allows customizing the position of the labels. The default value is "top", but it could also be "bottom", "left" or "right".
# install.packages("ggplot2")
library(ggplot2)

# Data simulation
set.seed(4)
x <- runif(500)
y <- 4 * x ^ 2 + rnorm(length(x), sd = 5)
group <- ifelse(x < 0.4, "G1", ifelse(x < 0.6, "G2", ifelse(x < 0.8, "G3", "G4")))
x <- x + runif(length(x), -0.5, 0.5)

# Data frame
df <- data.frame(x = x, y = y, group = group)

# Ribbon of plots
ggplot(df, aes(x = x, y = y, color = group)) +
  geom_point(show.legend = FALSE) +
  facet_wrap(~group, strip.position = "bottom")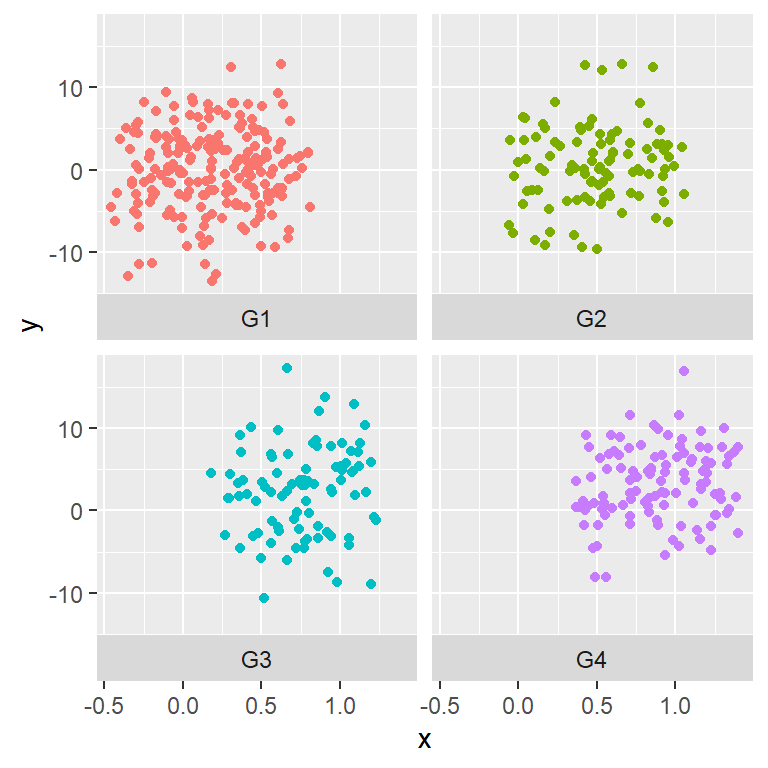
Highlight each group showing all the data behind
It is possible to add all the data to all panels and highlight the corresponding data for each one. For this purpose you will need to create a new layer passing as input the same data frame used before but removing the categorical variable (in this example is named group).
# install.packages("ggplot2")
library(ggplot2)

# Data simulation
set.seed(4)
x <- runif(500)
y <- 4 * x ^ 2 + rnorm(length(x), sd = 5)
group <- ifelse(x < 0.4, "G1", ifelse(x < 0.6, "G2", ifelse(x < 0.8, "G3", "G4")))
x <- x + runif(length(x), -0.5, 0.5)

# Data frame
df <- data.frame(x = x, y = y, group = group)

# Ribbon of plots
ggplot(df, aes(x = x, y = y, color = group)) +
  geom_point(data = transform(df, group = NULL), colour = "grey85") +
  geom_point(show.legend = FALSE) +
  facet_wrap(~group, strip.position = "bottom")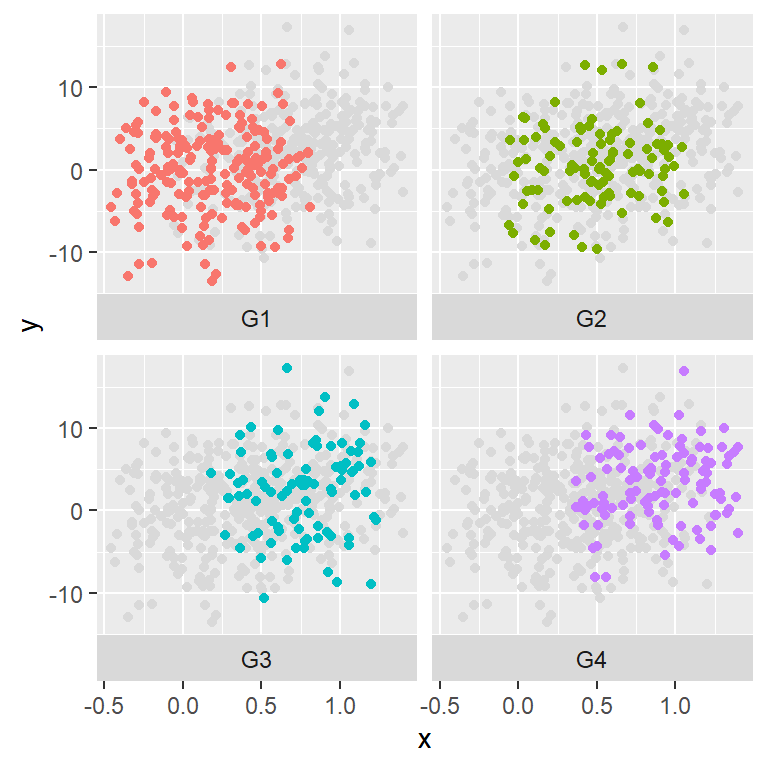
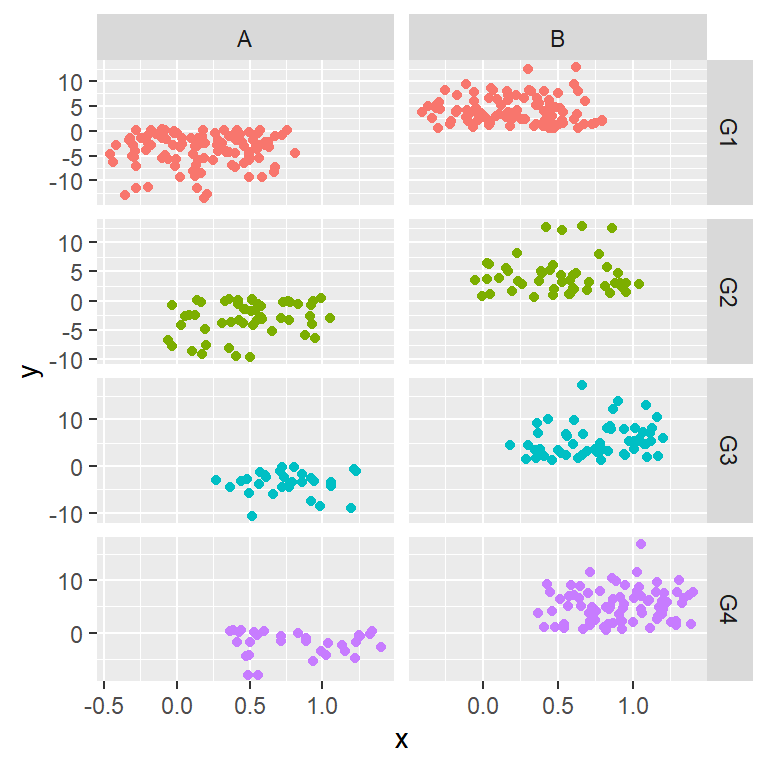
Two discrete variables: facet_grid
The facet_grid function is very similar to facet_wrap, but this function creates panels showing all the combinations of the data for two categorical variables. There are two ways to input data: the function can take a formula with the names of the categorical variables or you can pass the names of the variables to rows and cols arguments making use of the vars function.

# install.packages("ggplot2")
library(ggplot2)

# Data simulation
set.seed(4)
x <- runif(500)
y <- 4 * x ^ 2 + rnorm(length(x), sd = 5)
group1 <- ifelse(x < 0.4, "G1", ifelse(x < 0.6, "G2", ifelse(x < 0.8, "G3", "G4")))
group2 <- ifelse(y < 0.5, "A", "B")
x <- x + runif(length(x), -0.5, 0.5)

# Data frame
df <- data.frame(x = x, y = y, group1 = group1, group2 = group2)

# Matrix of plots
ggplot(df, aes(x = x, y = y, color = group1)) +
  geom_point(show.legend = FALSE) +
  facet_grid(group1 ~ group2) # Or facet_grid(rows = vars(group1), cols = vars(group2))
Axis scales
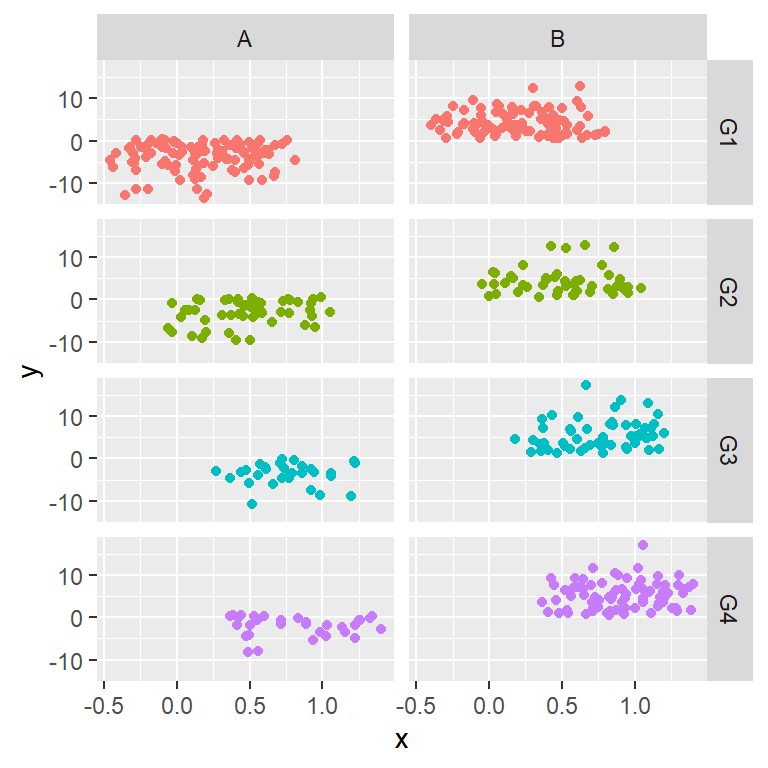
The facet_grid function also provides the scales argument to let the axis scales vary across rows and/or columns.
# install.packages("ggplot2")
library(ggplot2)

# Data simulation
set.seed(4)
x <- runif(500)
y <- 4 * x ^ 2 + rnorm(length(x), sd = 5)
group1 <- ifelse(x < 0.4, "G1", ifelse(x < 0.6, "G2", ifelse(x < 0.8, "G3", "G4")))
group2 <- ifelse(y < 0.5, "A", "B")
x <- x + runif(length(x), -0.5, 0.5)

# Data frame
df <- data.frame(x = x, y = y, group1 = group1, group2 = group2)

# Matrix of plots
ggplot(df, aes(x = x, y = y, color = group1)) +
  geom_point(show.legend = FALSE) +
  facet_grid(group1 ~ group2, scales = "free")
Panels size
If the panels scales vary, you can use the space argument to make the panels have different size. Possible values are "fixed" (default), "free_y" to free the heights, "free_x", to free the widths and "free" to let both the width and height vary. Note that in this example the argument doesn’t make any difference as all panels have the same scale.
# install.packages("ggplot2")
library(ggplot2)

# Data simulation
set.seed(4)
x <- runif(500)
y <- 4 * x ^ 2 + rnorm(length(x), sd = 5)
group1 <- ifelse(x < 0.4, "G1", ifelse(x < 0.6, "G2", ifelse(x < 0.8, "G3", "G4")))
group2 <- ifelse(y < 0.5, "A", "B")
x <- x + runif(length(x), -0.5, 0.5)

# Data frame
df <- data.frame(x = x, y = y, group1 = group1, group2 = group2)

# Matrix of plots
ggplot(df, aes(x = x, y = y, color = group1)) +
  geom_point(show.legend = FALSE) +
  facet_grid(group1 ~ group2, space = "free_x")
The facet_grid function provides more arguments, such as shrink, labeller, as.table, switch, drop and margins. Recall to read the documentation for further details if needed.
Further customization of the strips and panels
Using the arguments of the theme function you can customize the strips and panels. In the following examples we are going to review some use cases.
Customization of the strips of facet_wrap
You can customize the text styling of the labels with the strip_text argument. This argument takes the element_text function as input, where you can specify the different styles, such as the color, size, adjustment, etc. If you want to remove the labels use element_blank instead.
In order to customize the background color you will need to pass the element_rect function to strip.background and set the fill color with fill. In case you want to add a border you will need to set a line type, a color and a line width.
# install.packages("ggplot2")
library(ggplot2)

# Data simulation
set.seed(4)
x <- runif(500)
y <- 4 * x ^ 2 + rnorm(length(x), sd = 5)
group <- ifelse(x < 0.4, "G1", ifelse(x < 0.6, "G2", ifelse(x < 0.8, "G3", "G4")))
x <- x + runif(length(x), -0.5, 0.5)

# Data frame
df <- data.frame(x = x, y = y, group = group)

# Ribbon of plots
ggplot(df, aes(x = x, y = y, color = group)) +
  geom_point(show.legend = FALSE) +
  facet_wrap(~group) +
  theme(strip.text = element_text(face = "bold", color = "white", hjust = 0, size = 15),
        strip.background = element_rect(fill = "dodgerblue3", linetype = "solid",
                                        color = "black", linewidth = 1))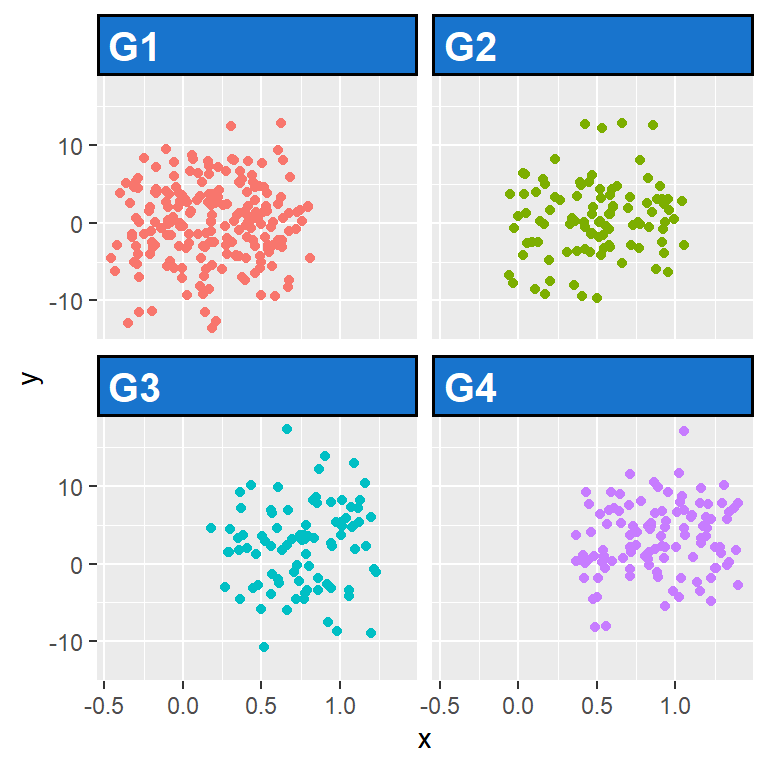
Customization of the strips of facet_grid
If you have created a multi panel plot with facet_grid you can customize the strips the same way as in the example before, but you can also customize the labels for each axis individually making use of strip.text.x, strip.text.y, strip.background.x and strip.background.y.
library(ggplot2)

# Data simulation
set.seed(4)
x <- runif(500)
y <- 4 * x ^ 2 + rnorm(length(x), sd = 5)
group1 <- ifelse(x < 0.4, "G1", ifelse(x < 0.6, "G2", ifelse(x < 0.8, "G3", "G4")))
group2 <- ifelse(y < 0.5, "A", "B")
x <- x + runif(length(x), -0.5, 0.5)

# Data frame
df <- data.frame(x = x, y = y, group1 = group1, group2 = group2)

# Ribbon of plots
ggplot(df, aes(x = x, y = y,)) +
  geom_point(show.legend = FALSE) +
  facet_grid(group1 ~ group2) +
  theme(strip.text.x = element_text(face = "bold", color = "white", hjust = 1, size = 15),
        strip.text.y = element_text(face = "bold", color = "white", hjust = 0, size = 15),
        strip.background.x = element_rect(fill = "dodgerblue3", linetype = "solid",
                                          color = "black", linewidth = 1),
        strip.background.y = element_rect(fill = "firebrick2", linetype = "solid",
                                          color = "gray30", linewidth = 1))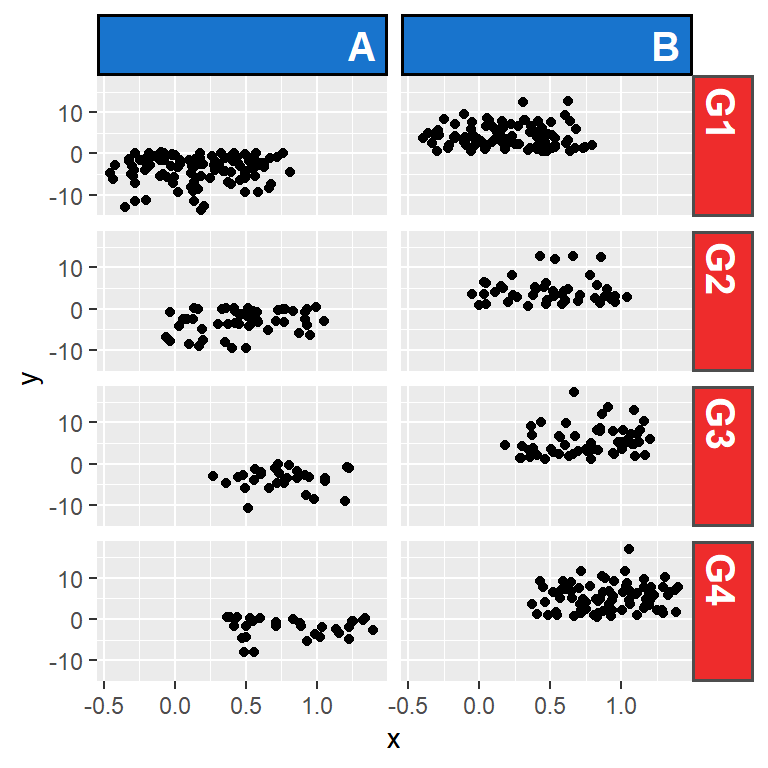
Remove the background color of the strips
Note that it is possible to remove the background of the strips passing the element_blank function to strip.background.
# install.packages("ggplot2")
library(ggplot2)

# Data simulation
set.seed(4)
x <- runif(500)
y <- 4 * x ^ 2 + rnorm(length(x), sd = 5)
group <- ifelse(x < 0.4, "G1", ifelse(x < 0.6, "G2", ifelse(x < 0.8, "G3", "G4")))
x <- x + runif(length(x), -0.5, 0.5)

# Data frame
df <- data.frame(x = x, y = y, group = group)

# Ribbon of plots
ggplot(df, aes(x = x, y = y, color = group)) +
  geom_point(show.legend = FALSE) +
  facet_wrap(~group) +
  theme(strip.text = element_text(size = 15),
        strip.background = element_blank())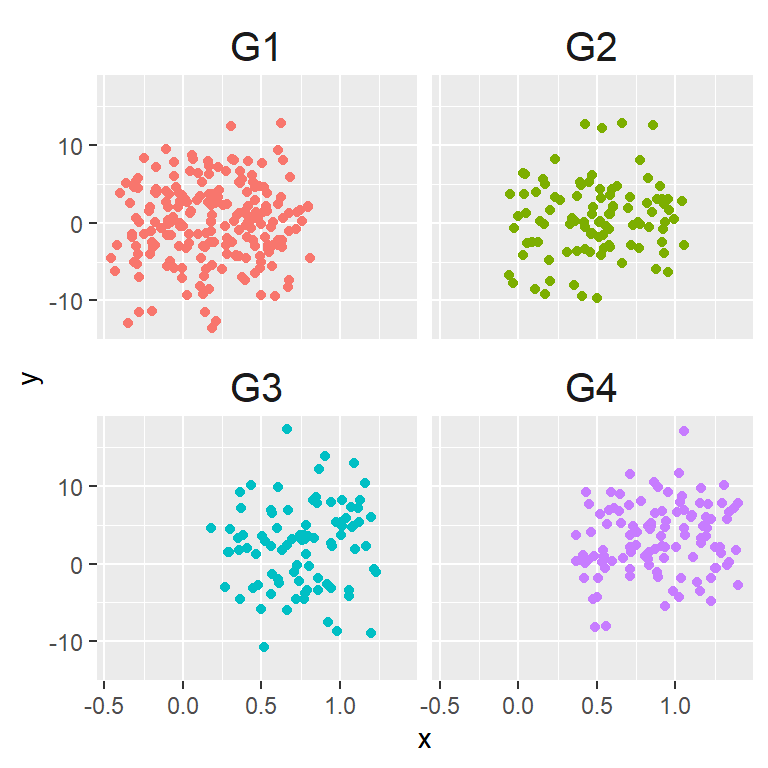
Increase or remove the space between the panels
By default, there is a small space between the panels. You can increase or decrease that space passing a unit to the panel.spacing argument of the theme function.
# install.packages("ggplot2")
library(ggplot2)

# Data simulation
set.seed(4)
x <- runif(500)
y <- 4 * x ^ 2 + rnorm(length(x), sd = 5)
group <- ifelse(x < 0.4, "G1", ifelse(x < 0.6, "G2", ifelse(x < 0.8, "G3", "G4")))
x <- x + runif(length(x), -0.5, 0.5)

# Data frame
df <- data.frame(x = x, y = y, group = group)

# Ribbon of plots
ggplot(df, aes(x = x, y = y, color = group)) +
  geom_point(show.legend = FALSE) +
  facet_wrap(~group) +
  theme(panel.spacing = unit(0, 'points'))
Add a border to the panels
Recall that you can also customize other parameters of the plots, such as adding a border to the panels. You can achieve this with panel.border, following the example below.
library(ggplot2)

# Data simulation
set.seed(4)
x <- runif(500)
y <- 4 * x ^ 2 + rnorm(length(x), sd = 5)
group <- ifelse(x < 0.4, "G1", ifelse(x < 0.6, "G2", ifelse(x < 0.8, "G3", "G4")))
x <- x + runif(length(x), -0.5, 0.5)

# Data frame
df <- data.frame(x = x, y = y, group = group)

# Ribbon of plots
ggplot(df, aes(x = x, y = y, color = group)) +
  geom_point(show.legend = FALSE) +
  facet_wrap(~group) +
  theme(panel.border = element_rect(fill = "transparent", # Needed to add the border
                                    color = "black", linewidth = 1.5))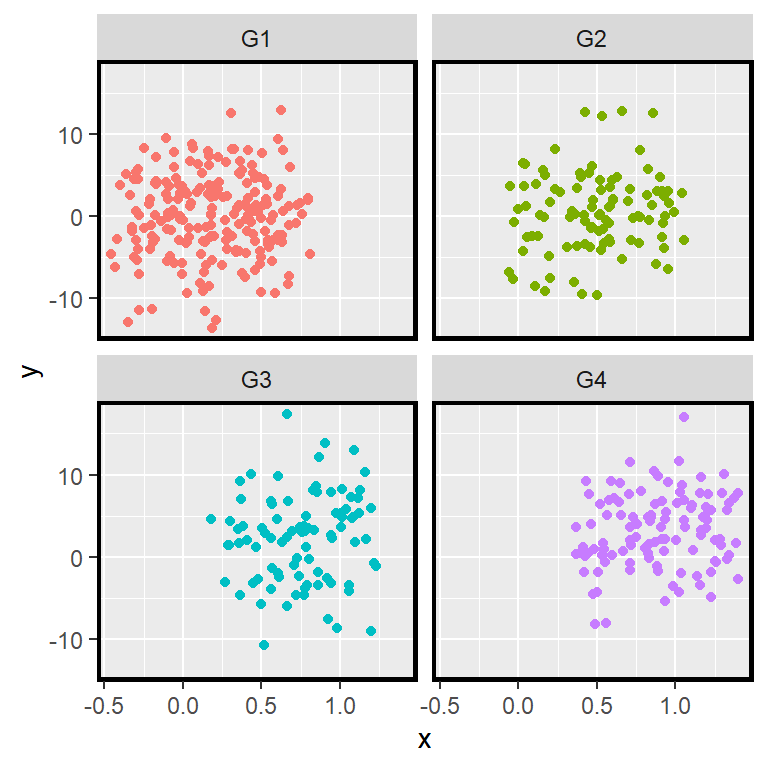

Master Statistics
Learn statistics from the basics to advanced techniques, clearly explained
Go to site