The ggplot2 package doesn’t provide a built-in functionality to arrange plots, but there are some packages that allow mixing ggplot2 objects into custom layouts. The most popular and easiest without doubt is patchwork, but there are some other alternatives, such as cowplot or gridExtra that we will also review in this tutorial.
Sample plots
In order to make all the examples of this tutorial reproducible we are going to create four different plots and assign them to objects named p1, p2, p3 and p4. You can use any other names, but we will use these for convention.
# install.packages("ggplot2")
library(ggplot2)
# Data simulation
set.seed(5)
x <- runif(100)
df <- data.frame(x = seq_along(x), var = x)
# Box plot
p1 <- ggplot(df, aes(x = "", y = var)) +
geom_boxplot()
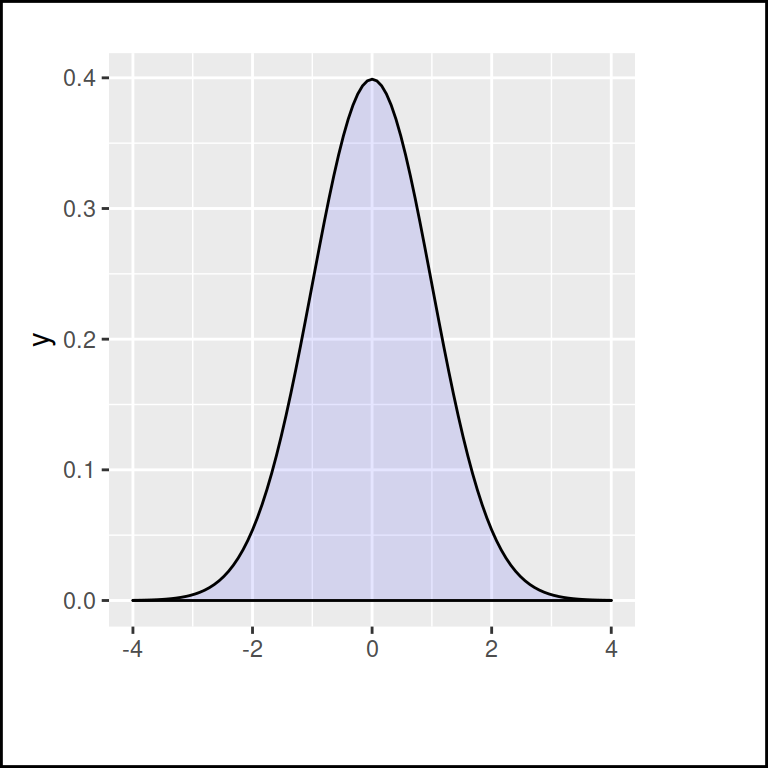
# Density plot
p2 <- ggplot() +
stat_function(fun = dnorm, geom = "density",
xlim = c(-3, 3), fill = "white")
# Line chart
p3 <- ggplot(df, aes(x = x, y = var)) +
geom_line(color = "gray20")
# Scatter plot
p4 <- ggplot(df, aes(x = x, y = var)) +
geom_point(color = "gray20")
# View the plots
p1
p2
p3
p4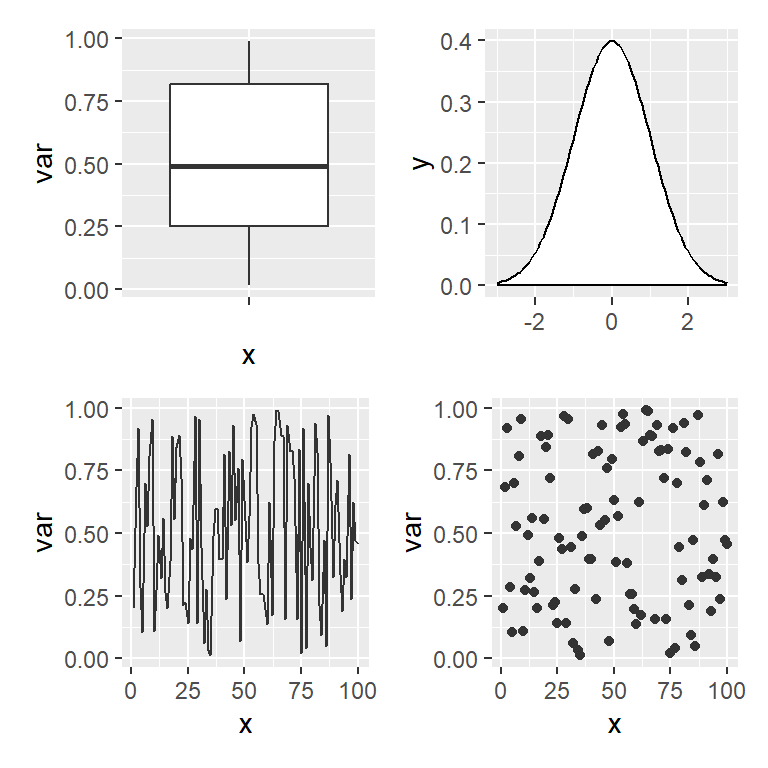
patchwork
Combining ggplot2 plots
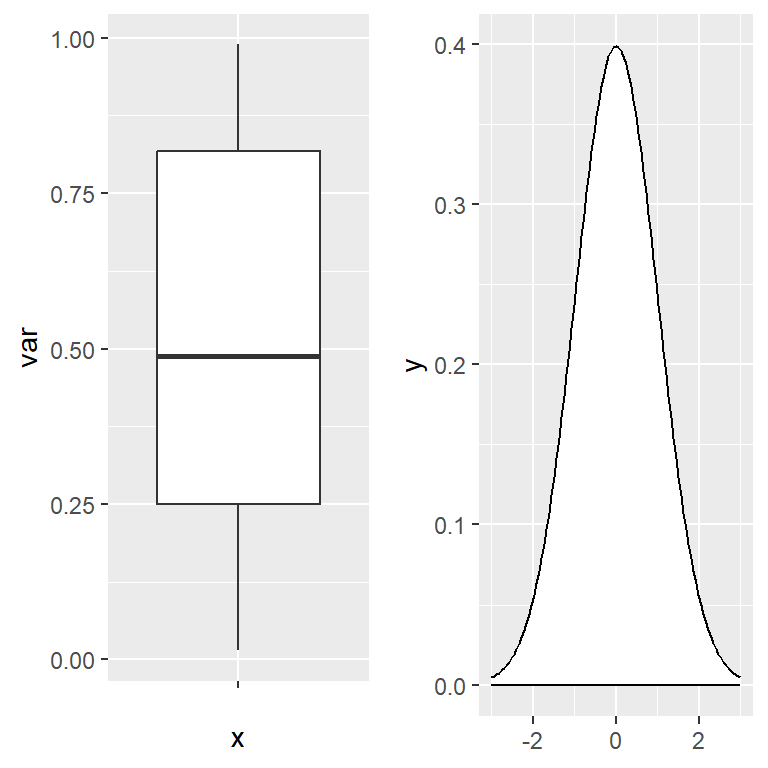
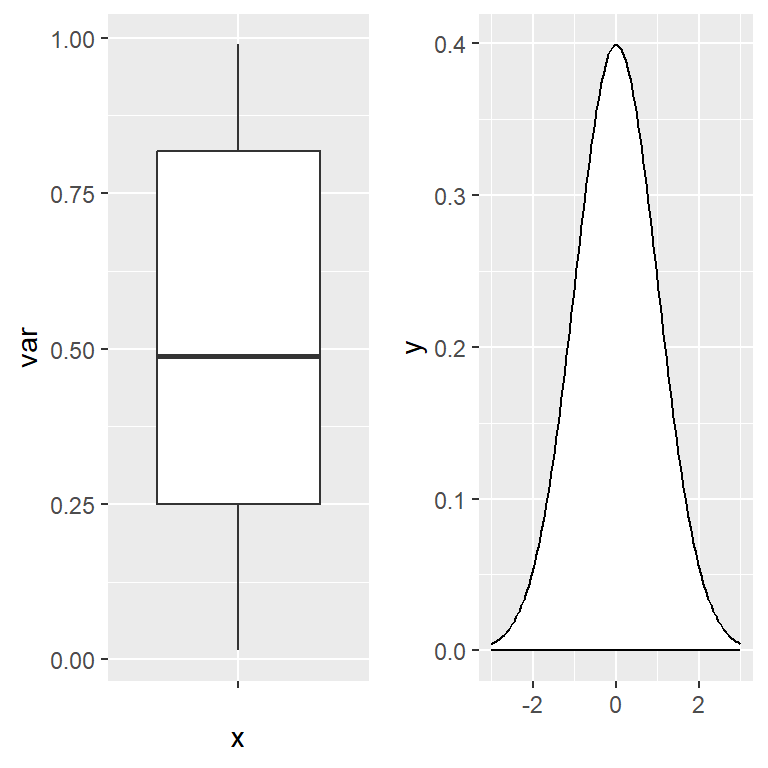
patchwork is designed to combine ggplot2 plots into the same figure easily. The basic usage just consist on saving the plots into objects, loading the library and then using the + operator to combine the charts, as if you were adding a new layer.
# install.packages("ggplot2")
# install.packages("patchwork")
library(ggplot2)
library(patchwork)

# Combine the plots
p1 + p2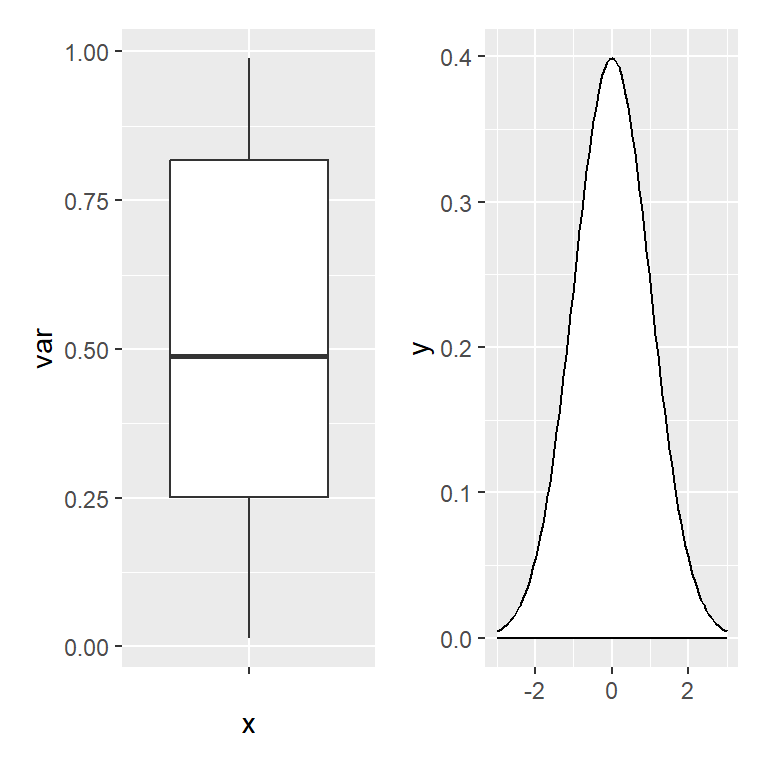
patchwork will perfectly align the ggplot2 plots.
Controlling the layout
When combining plots with +, patchwork will try to make the layout as square as possible, but if you want to customize the number of rows or columns of the figure you can use the plot_layout function. Note that you can also specify the relative widths and heights of the plots with widths and heights arguments.
# install.packages("ggplot2")
# install.packages("patchwork")
library(ggplot2)
library(patchwork)

# Combine the plots
p1 + p2 + p3 + p4 +
  plot_layout(ncol = 3)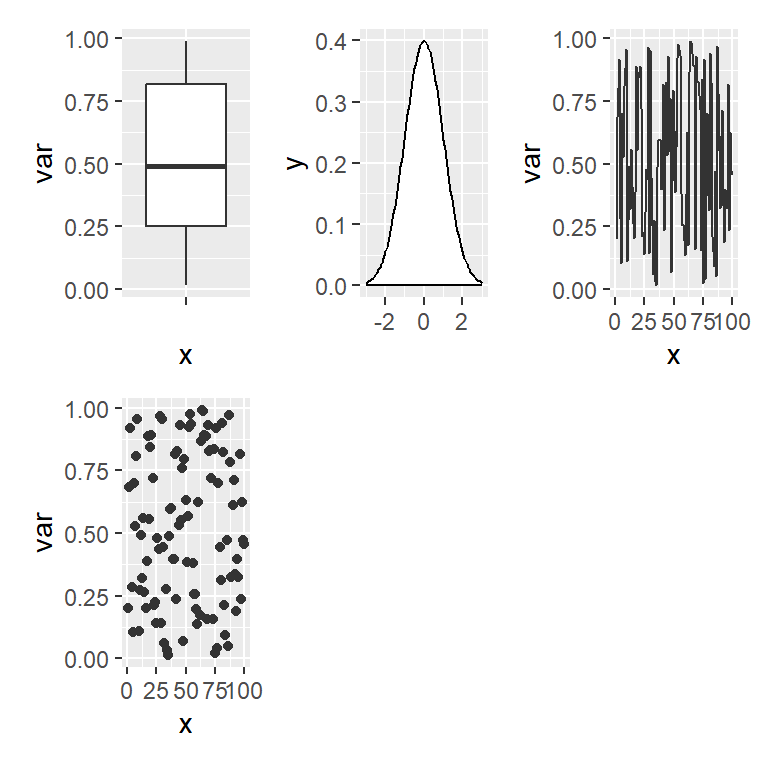
Probably the most interesting functionality of the plot_layout function is that you can create a custom layout design as shown in the example below, where 1, 2, 3 and 4 represents the locations for p1,p2, p3 and p4, respectively, and # represents an empty space. Recall that you can use numbers but also letters to represent the plot locations.
# install.packages("ggplot2")
# install.packages("patchwork")
library(ggplot2)
library(patchwork)

# Custom design (# means empty area)
design <- "
  111
  2#3
  443
"

# Combine the plots with a custom layout
p1 + p2 + p3 + p4 +
  plot_layout(design = design)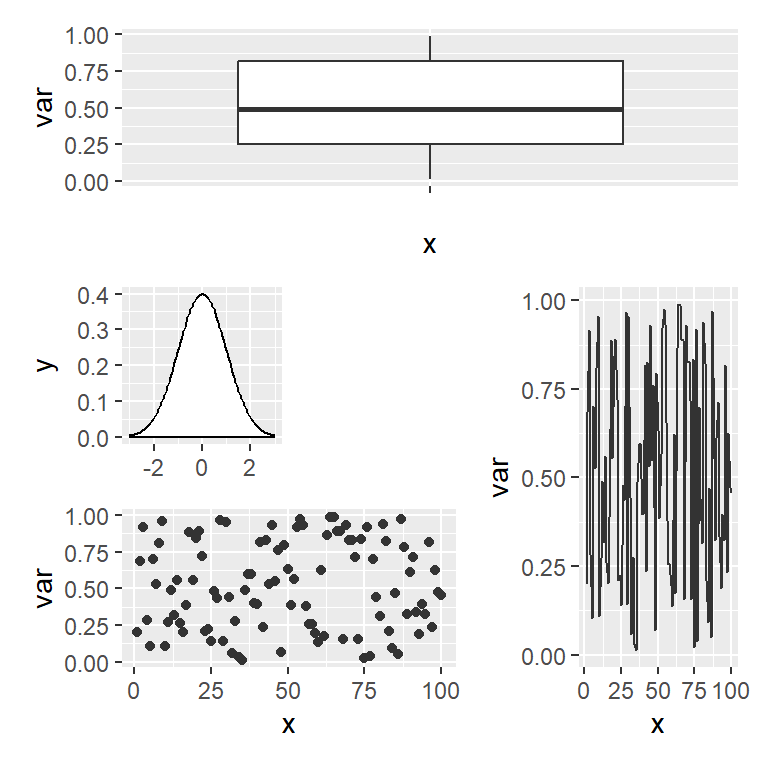
The wrap_plots function
Sometimes you can’t use the + operator programatically, so if you don’t know the number of plots beforehand you can use the wrap_plots function and pass a list of plots to it. This function also allows specifying the number of rows and columns, the sizes and the custom layouts.
# install.packages("ggplot2")
# install.packages("patchwork")
library(ggplot2)
library(patchwork)

# Combine the plots
wrap_plots(p1, p2, p3, p4,
           ncol = 2, nrow = 2,
           widths = c(1, 0.5), heights = c(0.5, 1))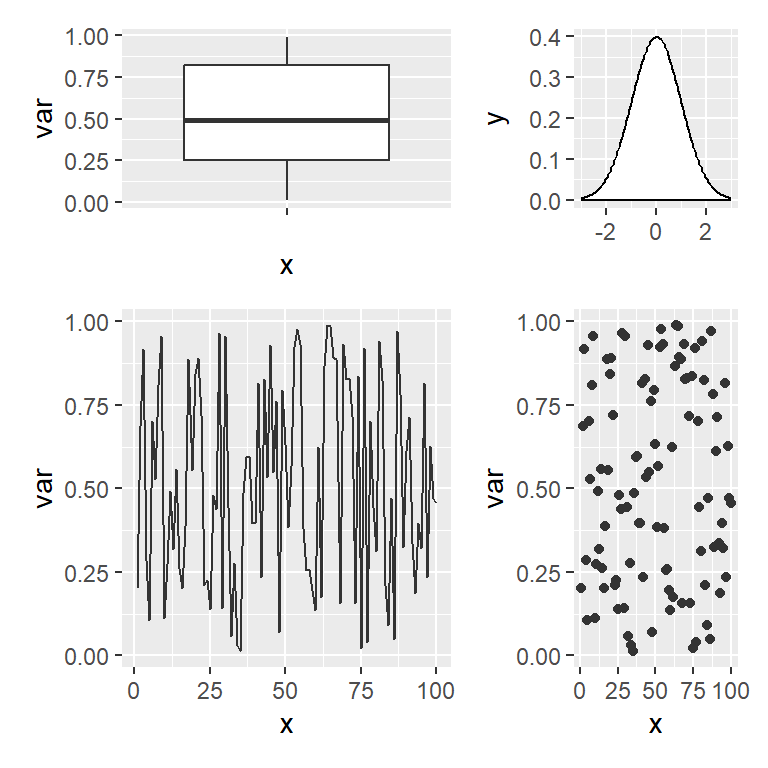
Adding spacers
When creating a custom layout you can use # to add spaces, as shown in one of the previous examples, but if you are using + there is also a function named plot_spacer to add spaces or gaps between plots.
# install.packages("ggplot2")
# install.packages("patchwork")
library(ggplot2)
library(patchwork)

# Plots with spaces
p1 + plot_spacer() + plot_spacer() + p3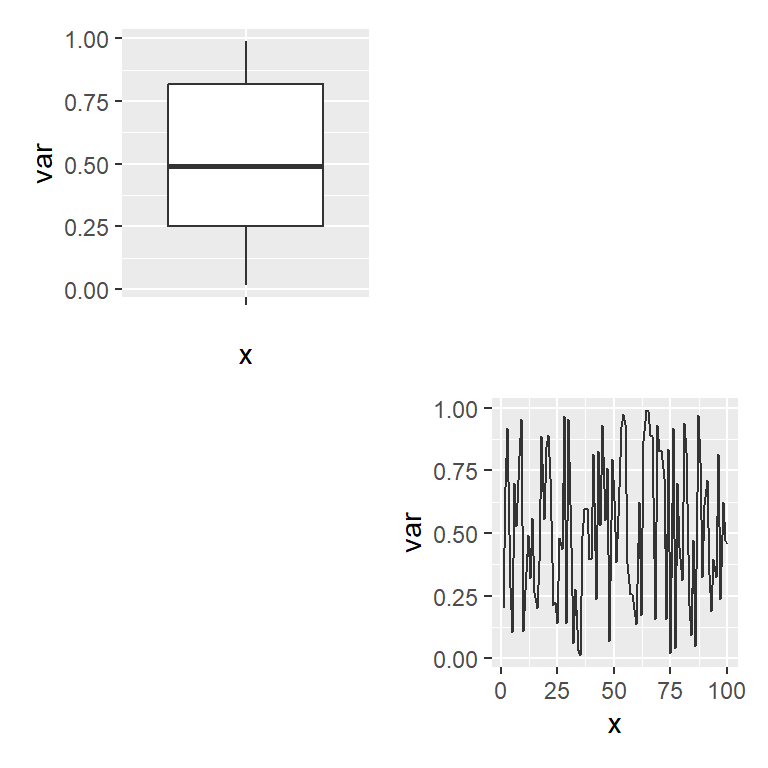
Operators
The patchwork package also provides two handy operators to place plots beside each other or to stack them.
Arranging ggplot2 plots in rows (beside each other)
The | operator places plots in a row. This operator is similar to + when you have two plots but | will place all plots in a single row while + will try to create a square layout if possible.
# install.packages("ggplot2")
# install.packages("patchwork")
library(ggplot2)
library(patchwork)

# Combine the plots in rows
p1 | p2

# Equivalent to:
# p1 + p2 + plot_layout(nrow = 1)
Arranging ggplot2 plots in columns (stacked)
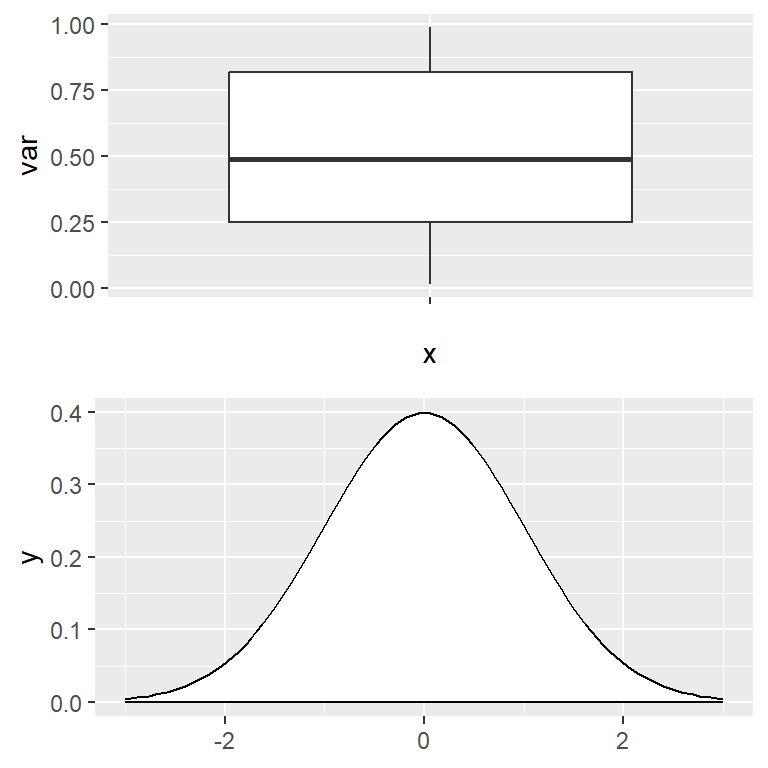
The / operator stacks the ggplot2 plots into columns without the need of using the plot_layout function and specifying ncol = 1.
# install.packages("ggplot2")
# install.packages("patchwork")
library(ggplot2)
library(patchwork)

# Combine the plots as column
p1 / p2

# Equivalent to:
# p1 + p2 + plot_layout(ncol = 1)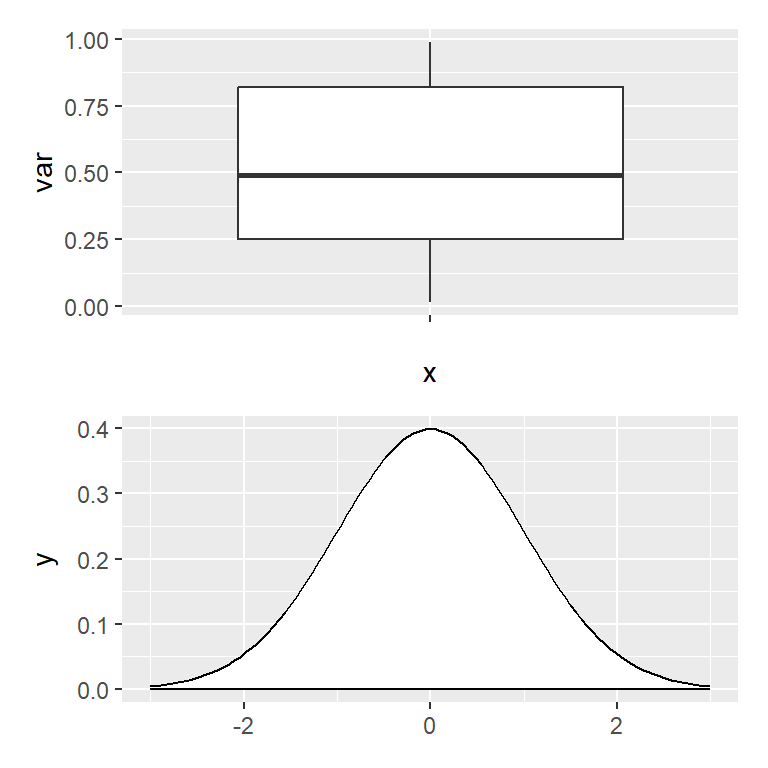
Nesting operators
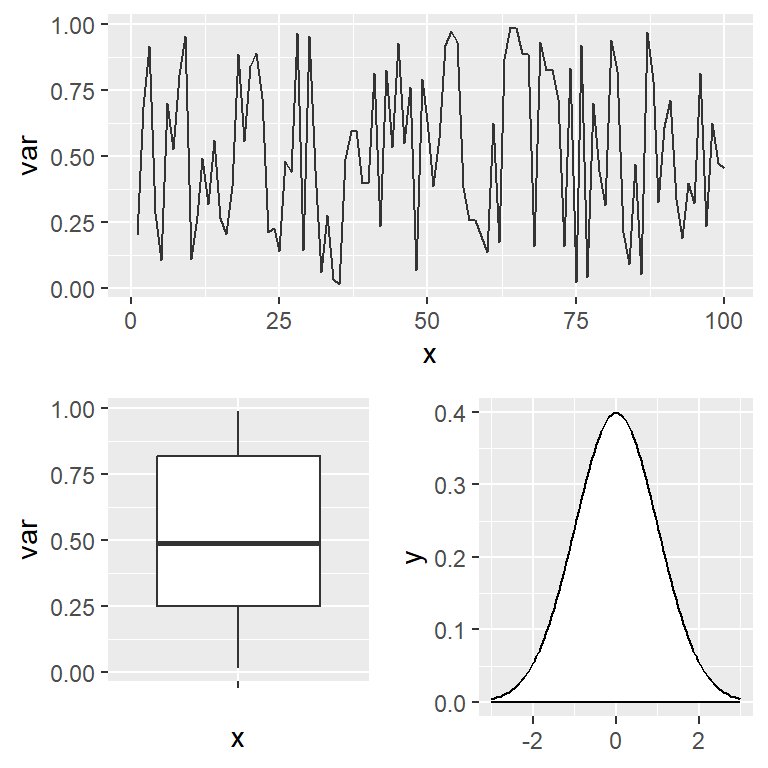
The previous operators can be nested to create complex layouts combining only a few operators. In the following example we are creating a layout with two plots at the top and one wider at the bottom.
# install.packages("ggplot2")
# install.packages("patchwork")
library(ggplot2)
library(patchwork)

# Two plots on top and one at the bottom
(p1 | p2) / p3
The following example is similar to the previous, but with one plot at the left and two at the right.
# install.packages("ggplot2")
# install.packages("patchwork")
library(ggplot2)
library(patchwork)

# One plot at the left and two at the right
p1 | (p2 / p3)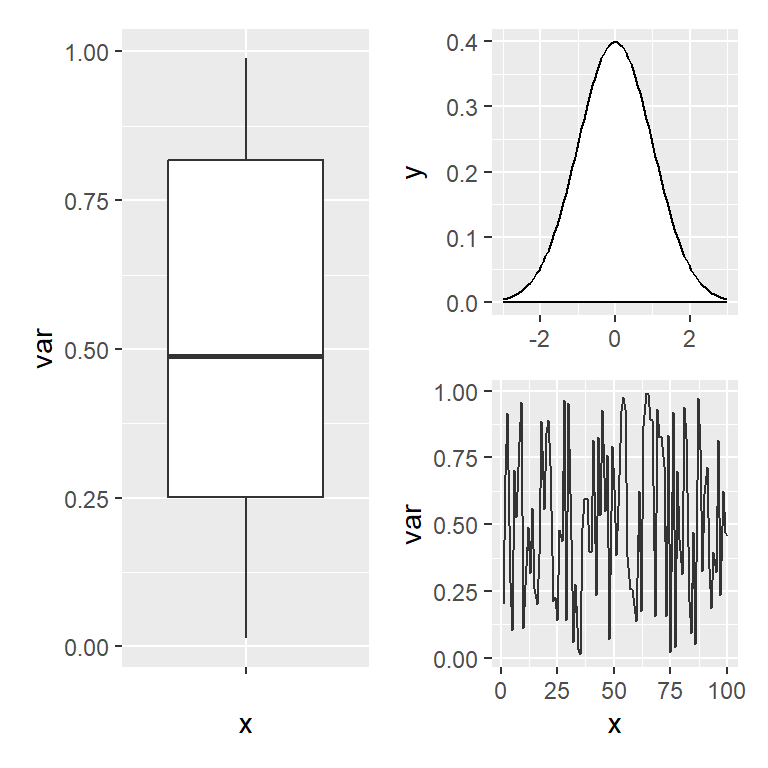
Titles and labels
Title for all the plots
You can add a title to all plots with the plot_annotation function and the title argument. Note that you can also add a subtitle and a caption with the corresponding arguments.
# install.packages("ggplot2")
# install.packages("patchwork")
library(ggplot2)
library(patchwork)

# Title for the combined plots
p1 + ((p2 | p3) / p4) +
plot_annotation(title = 'Title for all the plots',
                subtitle = "Subtitle",
                caption = "Caption")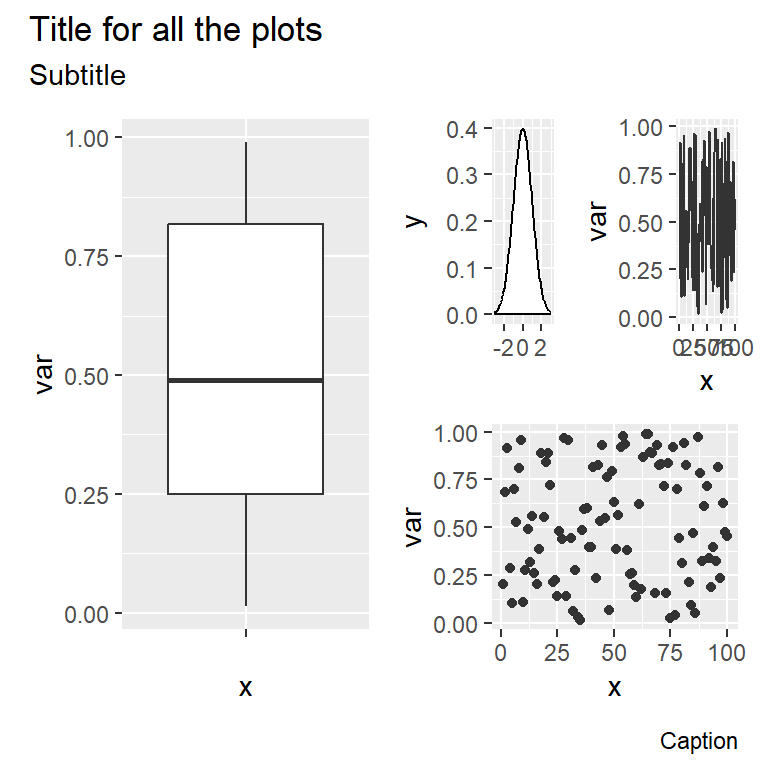
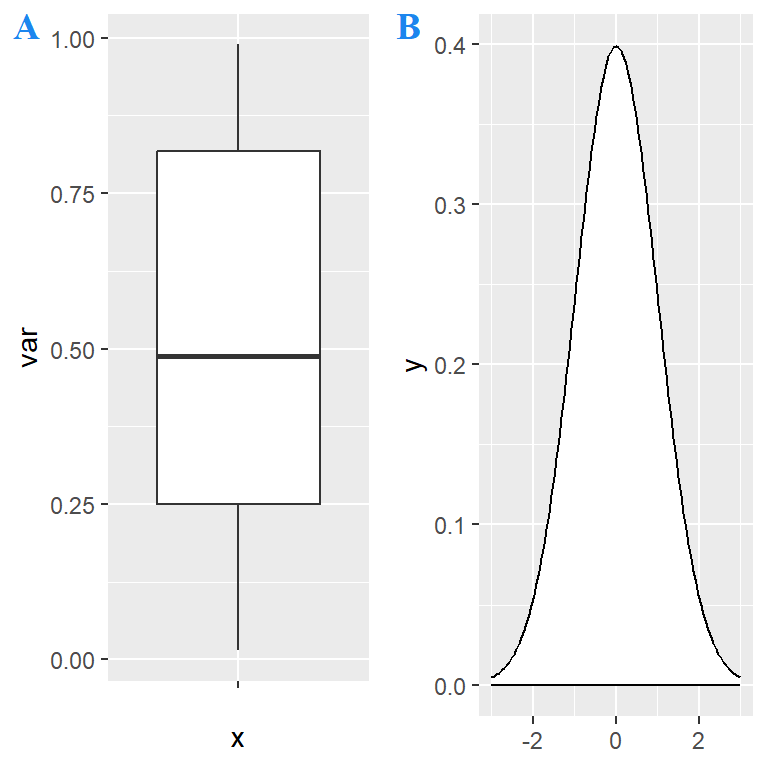
The plot_annotation function can also be used to label each plot individually with the tags_level argument. Possible options are "1" for numbers, "a" for lowercase letters, "A" for uppercase letters, "i" for lowercase Roman numerals, "I" for uppercase Roman numerals or a vector with your own tags.
# install.packages("ggplot2")
# install.packages("patchwork")
library(ggplot2)
library(patchwork)

# Labels for each plot
p1 + p2 + plot_annotation(tag_levels = "A")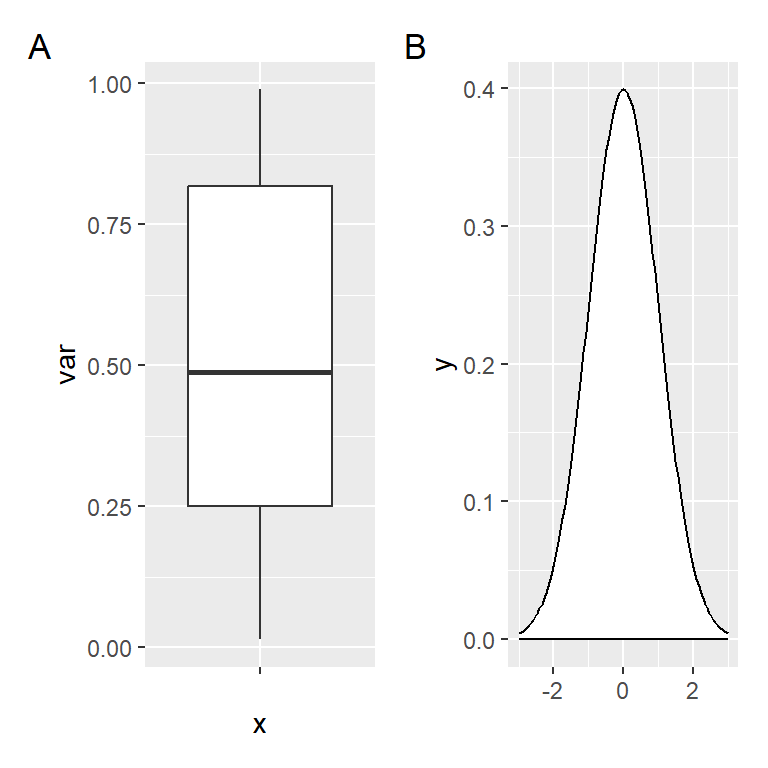
The labels can be customized with the tag_prefix, tag_suffix and tag_sep arguments. In the example below we add "Plot " as prefix of the labels.
# install.packages("ggplot2")
# install.packages("patchwork")
library(ggplot2)
library(patchwork)

# Labels for each plot
p1 + p2 + plot_annotation(tag_levels = "A", tag_prefix = "Plot ")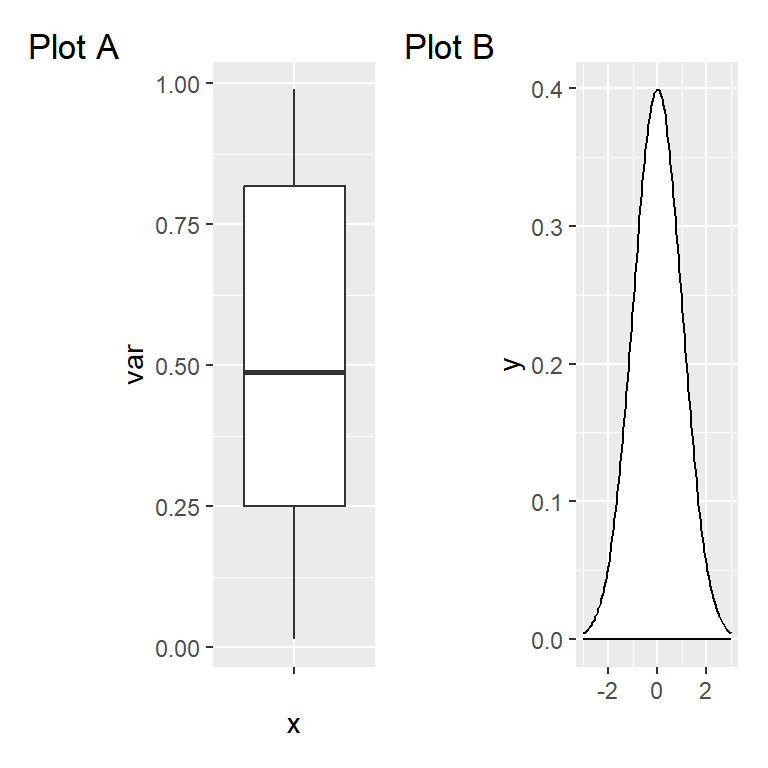
Adding more layers
The figures created with patchwork behave the same way as a ggplot2 object, so you can add new layers as with normal plots, but the layer will be applied to the last added plot.
# install.packages("ggplot2")
# install.packages("patchwork")
library(ggplot2)
library(patchwork)

# Add a new layer
p2 + p1 +
  geom_jitter(color = "dodgerblue1")

# Equivalent to:
patch <- p2 + p1
patch + geom_jitter(color = "dodgerblue1")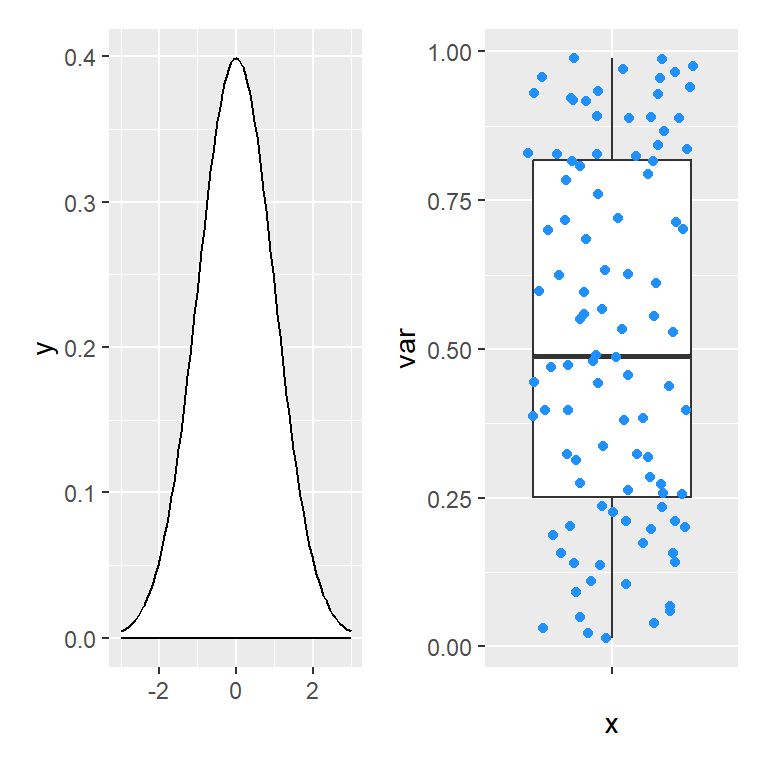
If you want to customize other than the last plot added you can add the new layer to it or save the patchwork, access the desired element and customize it, as shown in the following example.
# install.packages("ggplot2")
# install.packages("patchwork")
library(ggplot2)
library(patchwork)

# Add a new layer to the first plot
p2 + theme_bw() + p1

# Equivalent to:
patch <- p2 + p1
patch[[1]] <- patch[[1]] + theme_bw()
patch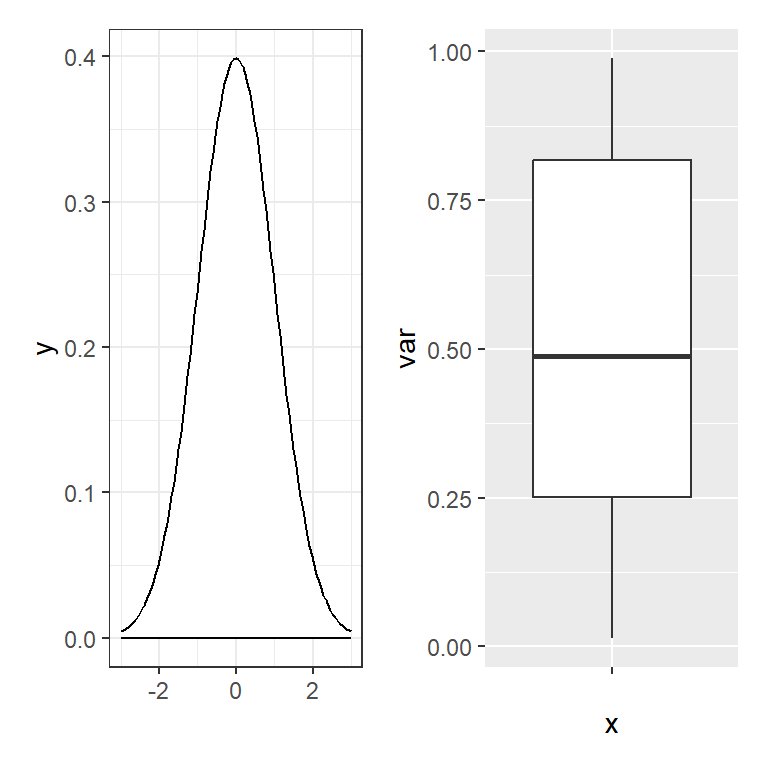
Modifying all plots at the same time
patchwork also provides the & operator to modify all the plots at the same time. This is very useful, for instance, to set the same theme for all plots at the same time, as shown in the example below.
# install.packages("ggplot2")
# install.packages("patchwork")
library(ggplot2)
library(patchwork)

# Change the theme for all plots
p1 + p2 + p3 + p4 & theme_classic()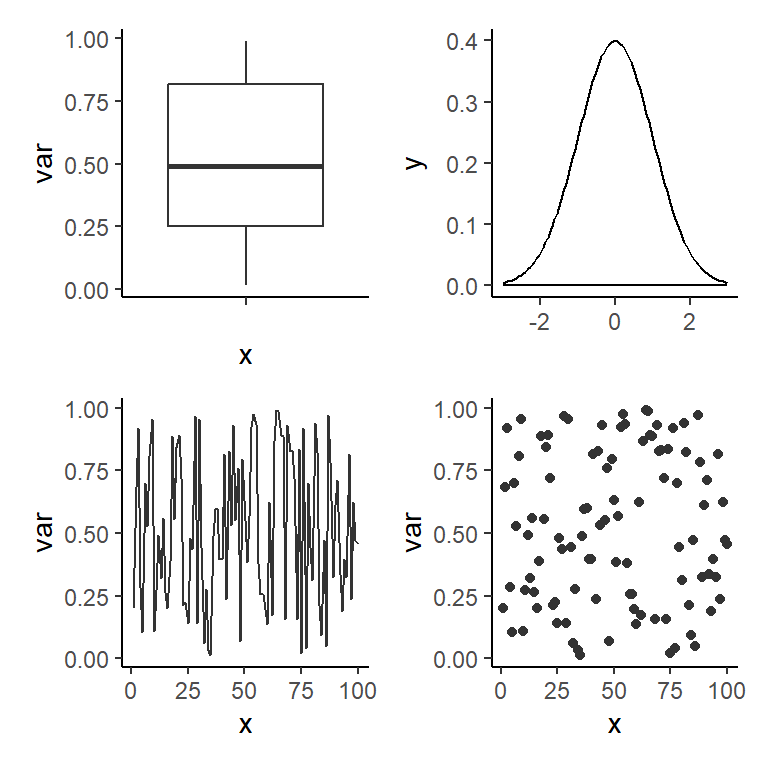
Adding base R plots, tables and text
In the previous examples we have seen all the possibilities that patchwork provides to combine ggplot2 plots, but you can also create layout mixing ggplot2 plots, base R plots, tables and texts. If you want to combine a ggplot2 plot and a base R plot you can use the wrap_elements function and add the base R plot with a ~ as prefix, e.g. ~plot(x, y).
# install.packages("ggplot2")
# install.packages("patchwork")
library(ggplot2)
library(patchwork)

# ggplot2 and base R
old_par <- par()
par(mar = c(0, 2, 0, 0), bg = NA)
p1 + wrap_elements(panel = ~plot(1:10))
par(old_par)
When adding base R plots and ggplot2 plots patchwork won’t be able to align the plots, so you will need to customize the margins for one of the plots and try to fine tune the values until you reach a good alignment.
Making use of the tableGrob function from the gridExtra package that we will review in the last section of this tutorial you can add a table to a layout created with patchwork.
# install.packages("ggplot2")
# install.packages("patchwork")
# install.packages("gridExtra")
library(ggplot2)
library(patchwork)
library(gridExtra)

tab <- t(round(quantile(df$var), 2))

# ggplot2 with table
p1 / tableGrob(tab)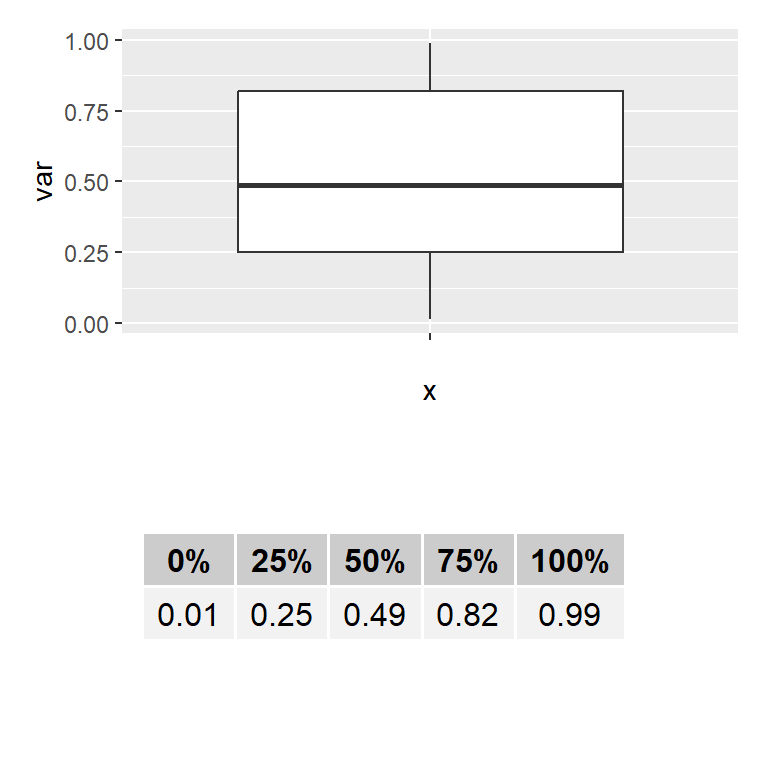
You can also use the textGrob function from gridExtra to add a text to the layout, but note that if you want the text to be the first element you will need to use the wrap_elements function.
# install.packages("ggplot2")
# install.packages("patchwork")
# install.packages("grid")
library(ggplot2)
library(patchwork)
library(grid)

# ggplot2 with text
p1 + textGrob('Text at the right')

# To put the text first use:
# wrap_elements(textGrob('Text at the left')) + p1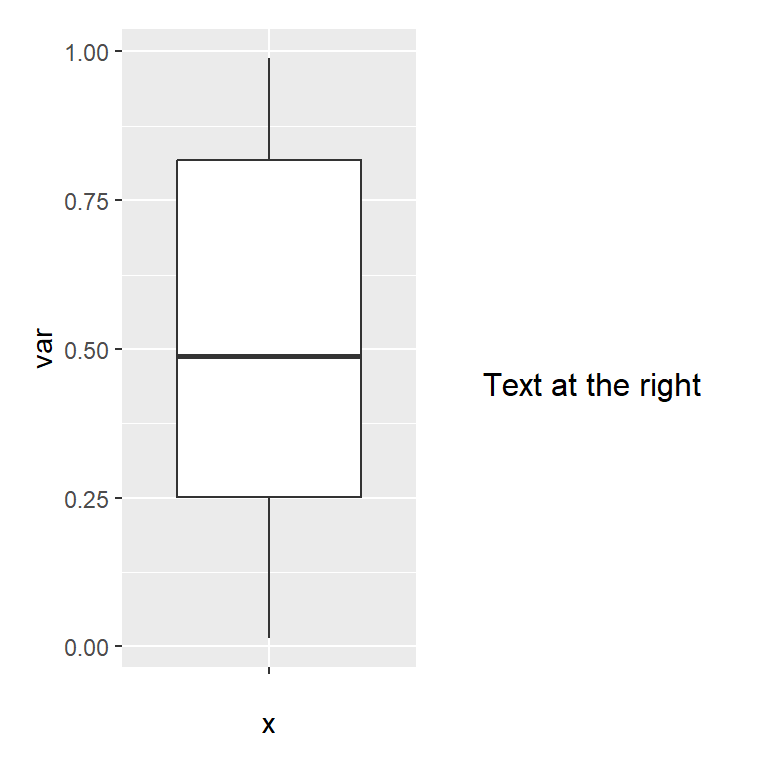
cowplot
The cowplot package provides different add-ons to ggplot2, but in this tutorial we are going to review the plot_grid function, which allows combining plots passing objects to the function. Note that you can also add base R plots by using a ~ as with patchwork.
# install.packages("ggplot2")
# install.packages("cowplot")
library(ggplot2)
library(cowplot)

plot_grid(p1, p2)
Aligning the plots
The function provides the align argument to set the desired alignment, which can be none ("none", the default), horizontal ("h"), vertical ("v") or aligned in both directions ("hv").
# install.packages("ggplot2")
# install.packages("cowplot")
library(ggplot2)
library(cowplot)

plot_grid(p1, p2, align = "h")
Number of rows and columns
The plot_grid function also let you choose the number of rows and columns used to create the grid of plots with the nrow and ncol arguments.
# install.packages("ggplot2")
# install.packages("cowplot")
library(ggplot2)
library(cowplot)

plot_grid(p1, p2, ncol = 1)
Adding labels to each plot
If you want to label each plot individually you can make use the labels argument of the function, where you can specify a vector of labels or use the "AUTO" or "auto" keywords for automatic labels in uppercase or lowercase, respectively. The function also provides several arguments to customize the style of the texts.
# install.packages("ggplot2")
# install.packages("cowplot")
library(ggplot2)
library(cowplot)

plot_grid(p1, p2,
          labels = c('A', 'B'), # Or "AUTO" or "auto"
          label_fontfamily = "serif",
          label_fontface = "bold",
          label_colour = "dodgerblue2")
Mixing plots with cowplot
With cowplot you can also create more complex layouts combining plot_grid functions, as shown in the example below, where we are creating a layout with two plots at the bottom and one at the top.
# install.packages("ggplot2")
# install.packages("cowplot")
library(ggplot2)
library(cowplot)

# Grid layout with cowplot
plot_grid(p3, plot_grid(p1, p2), ncol = 1)
gridExtra
The gridExtra package provides the grid.arrange function to combine several plots (grobs, gtables, ggplot2 and trellis objects) on a single figure.
# install.packages("ggplot2")
# install.packages("gridExtra")
library(ggplot2)
library(gridExtra)

# Combine the plots with gridExtra
grid.arrange(p2, p3, p1, p4)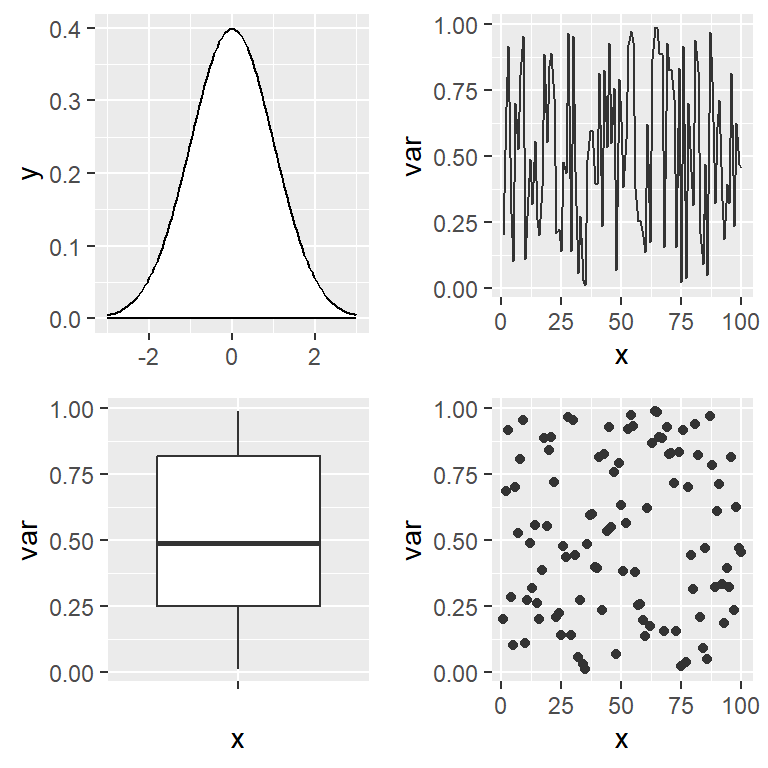
You can also specify the number of rows with nrow, the number of columns with ncol, and the proportional sizes with widths and heights.
The function also provides arguments to add labels at the four sides of the figure named top, bottom, left and right.
# install.packages("ggplot2")
# install.packages("gridExtra")
library(ggplot2)
library(gridExtra)

# Combine the plots
grid.arrange(p4, p3, p2, p1,
             top = "Top label", bottom = "Bottom label",
             left = "Left label", right = "Right label")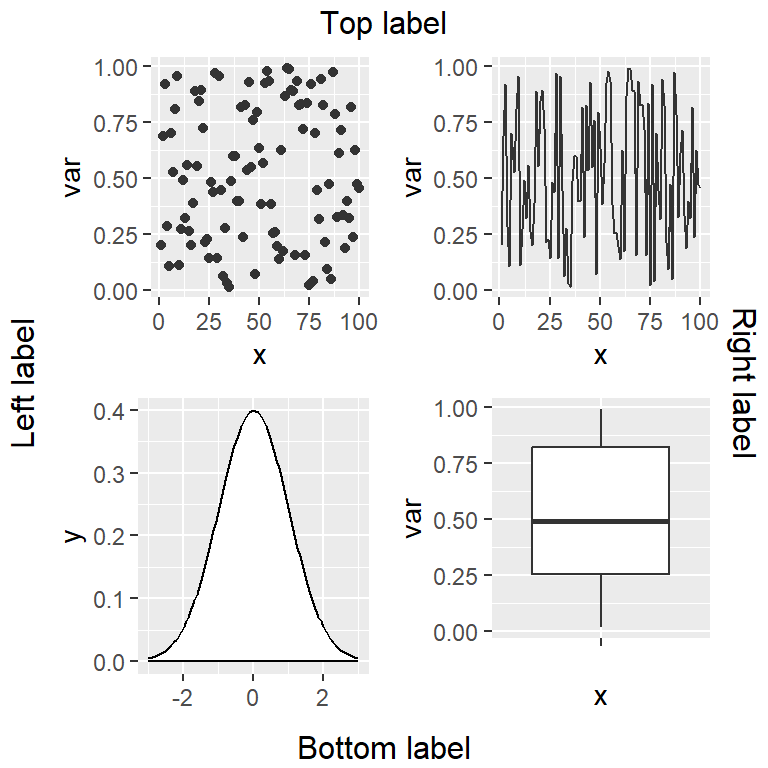
Similarly to the layouts created with patchwork you can create a matrix indicating the positions for each plot. Then you can pass this matrix to the layout_matrix argument in order to specify the desired layout.
# install.packages("ggplot2")
# install.packages("gridExtra")
library(ggplot2)
library(gridExtra)

# Custom layout
layout <- matrix(c(1, 1,
                   2, 3,
                   4, 4), ncol = 2, byrow = TRUE)

grid.arrange(p2, p3, p1, p4,
             layout_matrix = layout)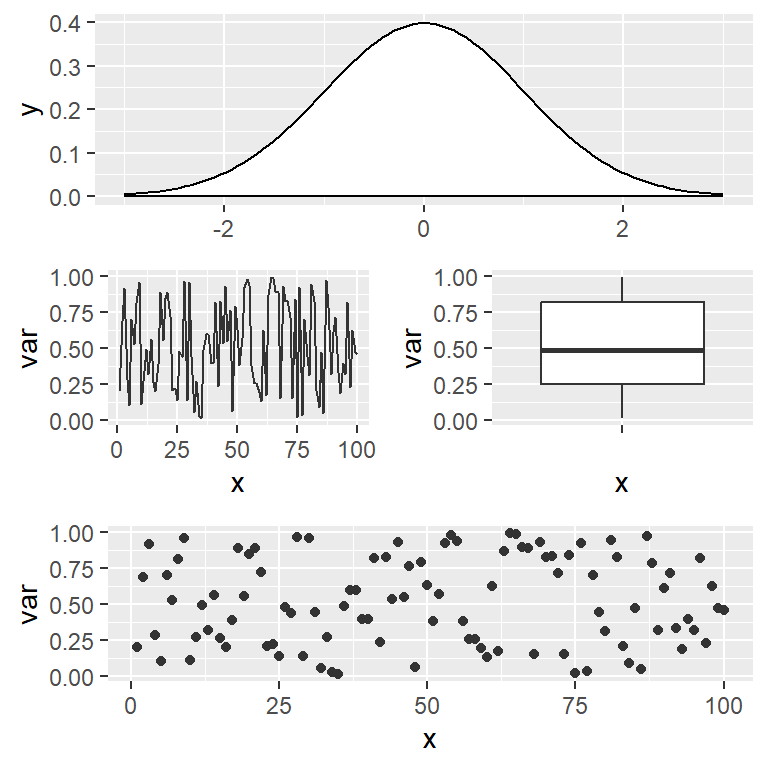

Master Statistics
Learn statistics from the basics to advanced techniques, clearly explained
Go to site