When using ggplot2 you can set a title, a subtitle, a caption and a tag. There are two ways to add titles: using ggtitle or labs function. The former is only for titles and subtitles and the latter also allows adding tags and captions.
Title
Option 1. Using ggtitle
# install.packages(ggplot2)
library(ggplot2)

ggplot(economics, aes(date, unemploy)) +
  geom_area(fill = rgb(0, 0.5, 1, alpha = 0.5)) +
  ggtitle("Title of the plot using ggtitle()")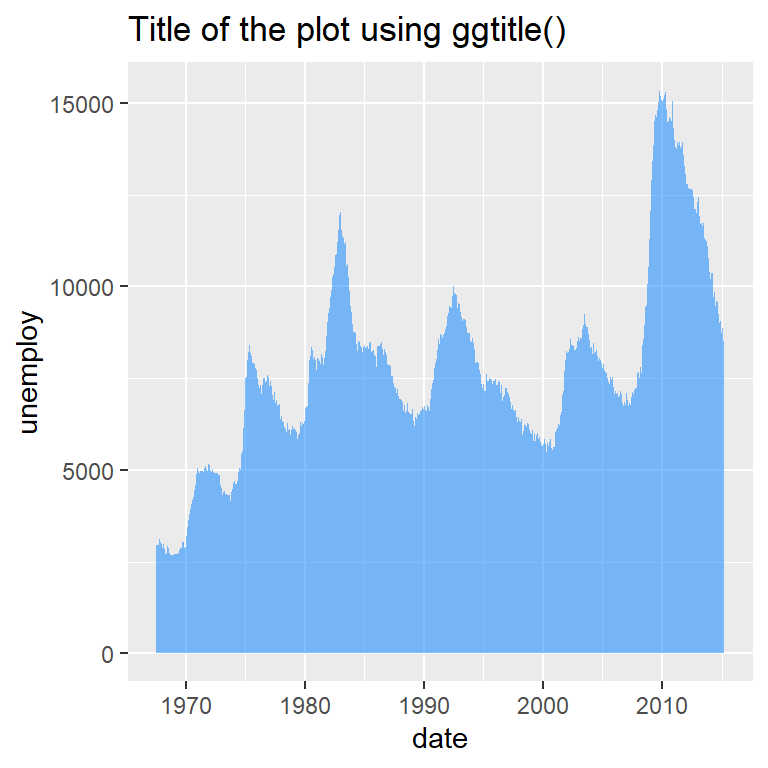
Option 2. Using labs
You can also use the labs function to add the title.
# install.packages(ggplot2)
library(ggplot2)

ggplot(economics, aes(date, unemploy)) +
  geom_area(fill = rgb(0, 0.5, 1, alpha = 0.5)) +
  labs(title = "Title of the plot using labs()")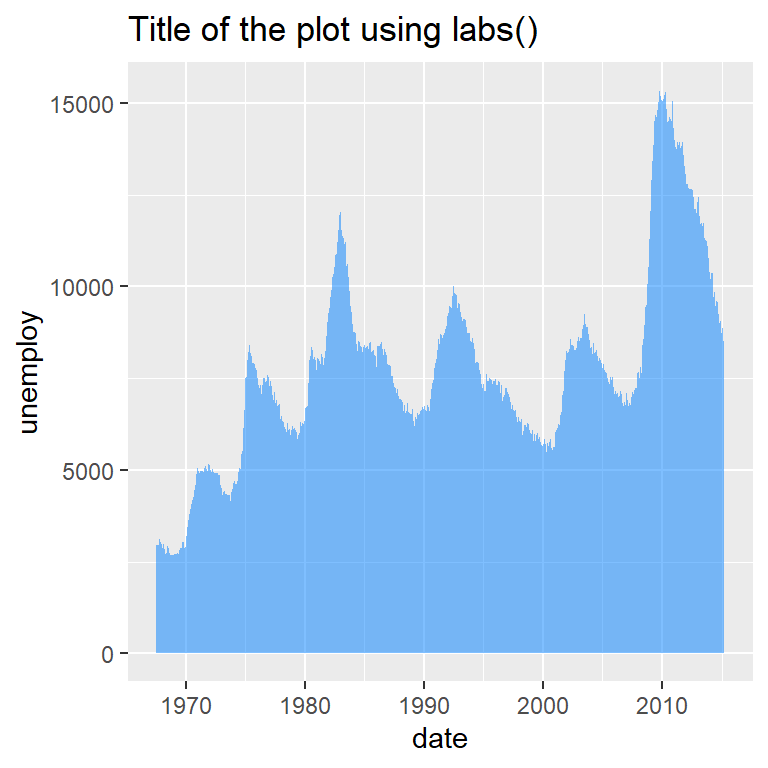
Title position
The title position can be set respect to the whole plot instead of the panel with the plot.title.position component of the theme function. Default value is "panel". This configuration also applies to the subtitle.
# install.packages(ggplot2)
library(ggplot2)

ggplot(economics, aes(date, unemploy)) +
  geom_area(fill = rgb(0, 0.5, 1, alpha = 0.5)) +
  labs(title = "Title on the plot margin") +
  theme(plot.title.position = "plot")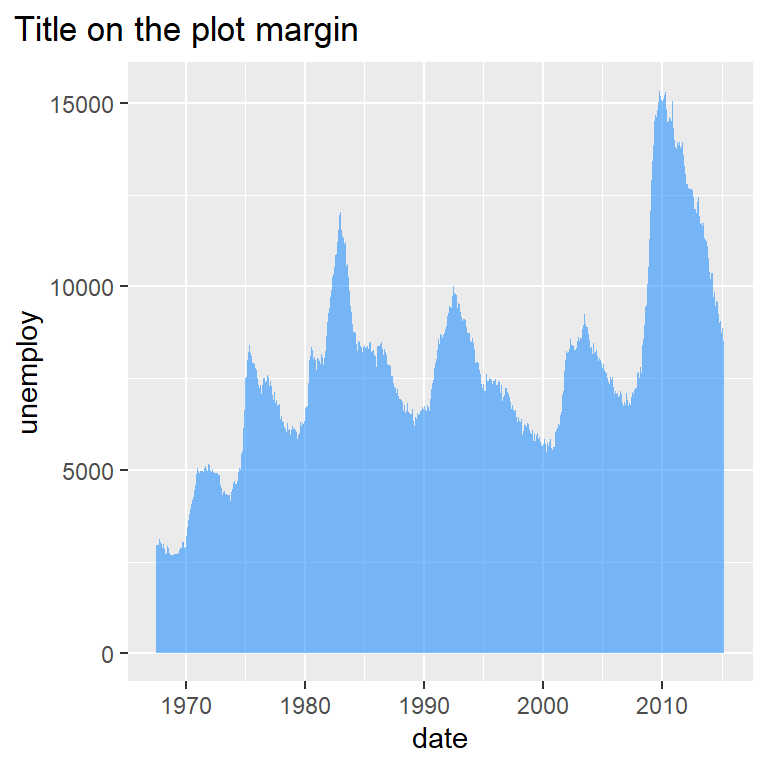
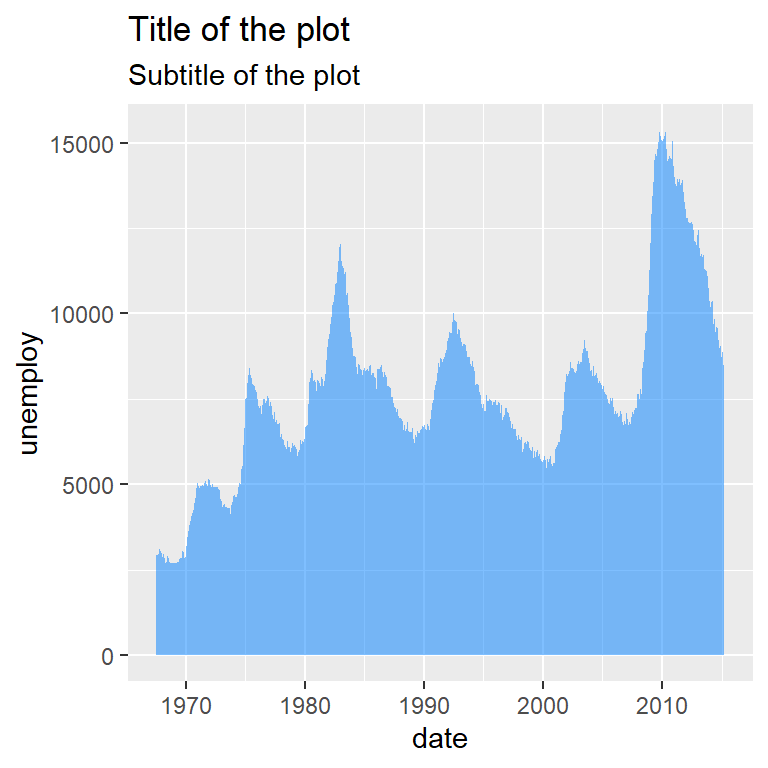
Subtitle
You can add a subtitle the same way you added the title, but with the subtitle argument.
Option 1. Using ggtitle
# install.packages(ggplot2)
library(ggplot2)

ggplot(economics, aes(date, unemploy)) +
  geom_area(fill = rgb(0, 0.5, 1, alpha = 0.5)) +
  ggtitle("Title of the plot",
          subtitle = "Subtitle of the plot")
Option 2. Using labs
# install.packages(ggplot2)
library(ggplot2)

ggplot(economics, aes(date, unemploy)) +
  geom_area(fill = rgb(0, 0.5, 1, alpha = 0.5)) +
  labs(title = "Title of the plot",
       subtitle = "Subtitle of the plot")
Caption
A caption can be used to describe the figure. You can add it with the caption argument of the labs function.
# install.packages(ggplot2)
library(ggplot2)

ggplot(economics, aes(date, unemploy)) +
  geom_area(fill = rgb(0, 0.5, 1, alpha = 0.5)) +
  labs(title = "Title of the plot",
       subtitle = "Subtitle of the plot",
       caption = "This is the caption")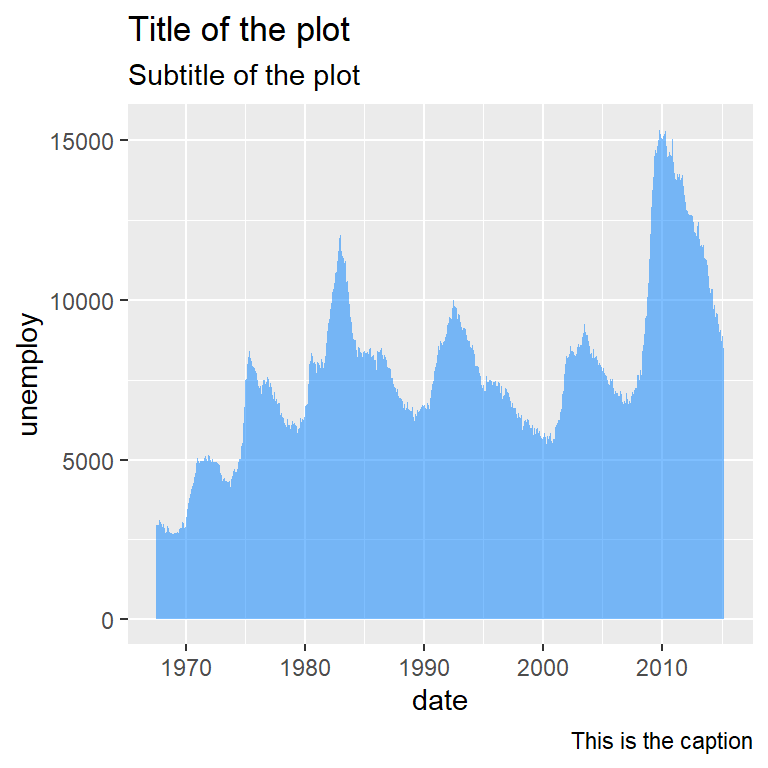
The plot.caption.position of the theme function allows aliging the caption to the panel ("panel", default) or the whole plot (“plot”).
# install.packages(ggplot2)
library(ggplot2)

ggplot(economics, aes(date, unemploy)) +
  geom_area(fill = rgb(0, 0.5, 1, alpha = 0.5)) +
  labs(caption = "This is the caption") +
  theme(plot.caption.position = "plot",
        plot.caption = element_text(hjust = 0))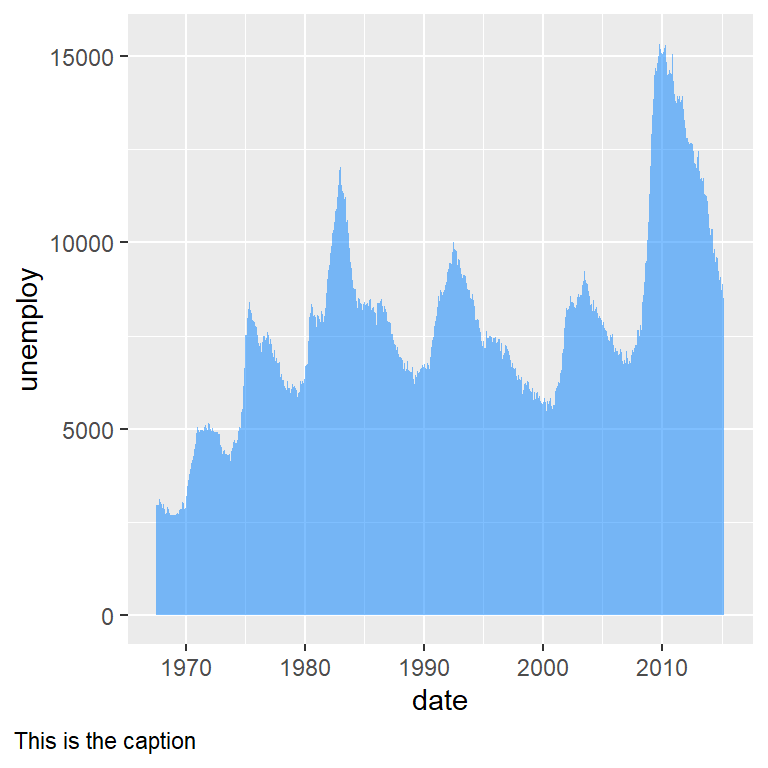
Note that the default for the caption is right alignment, so you can set hjust = 0 to move the caption to the left of the whole plot.
Tag
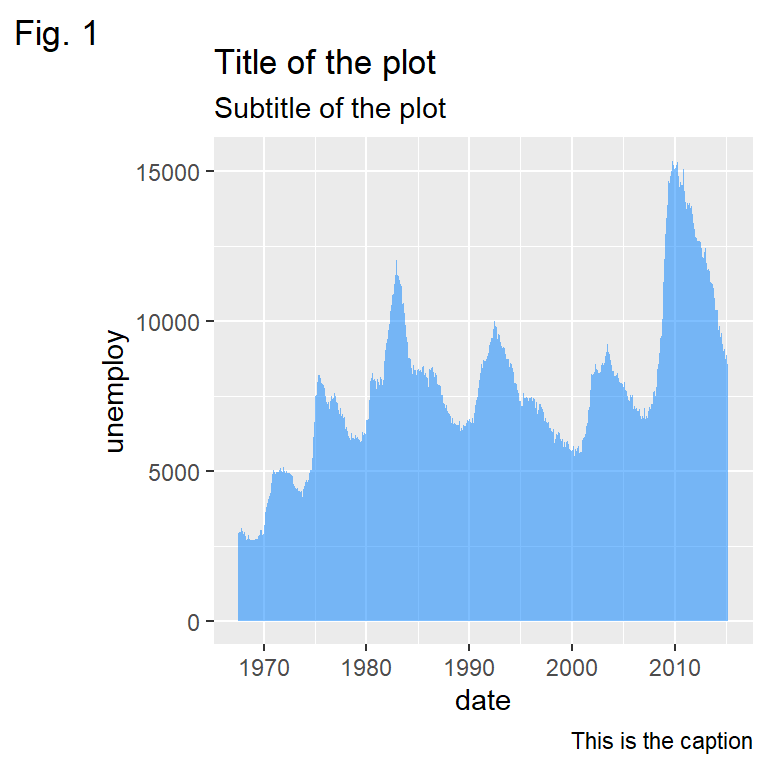
Tags are useful to indicate the figure numbering. You can add it with the tag argument of the labs function.
# install.packages(ggplot2)
library(ggplot2)

ggplot(economics, aes(date, unemploy)) +
  geom_area(fill = rgb(0, 0.5, 1, alpha = 0.5)) +
  labs(title = "Title of the plot",
       subtitle = "Subtitle of the plot",
       caption = "This is the caption",
       tag = "Fig. 1")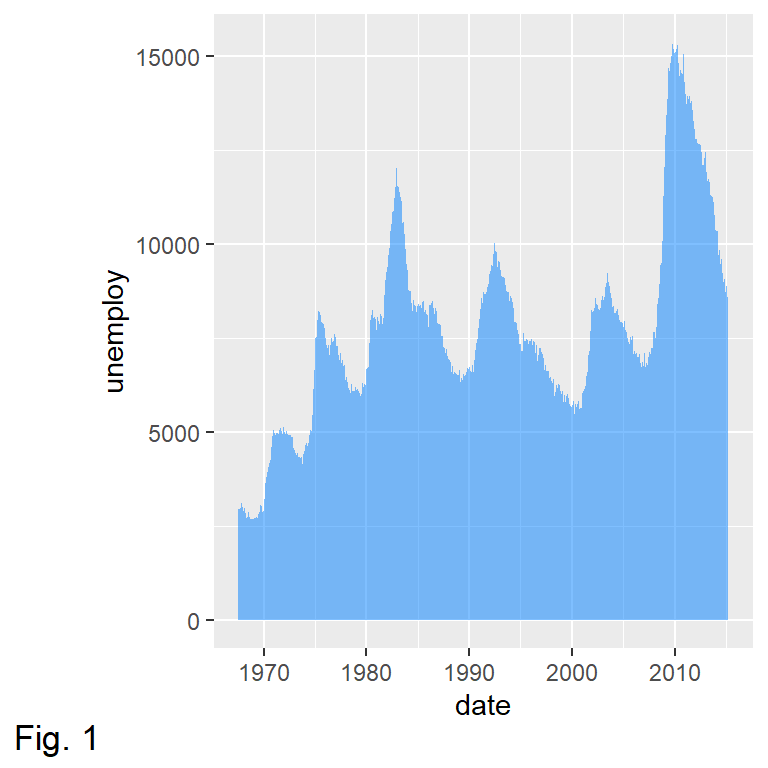
Tag position
The position of the tag can be set with the plot.tag.position component of the theme function. Possible values are "topleft" (default), "top", "topright", "left", "right", "bottomleft", "bottom" or "bottomright".
# install.packages(ggplot2)
library(ggplot2)

ggplot(economics, aes(date, unemploy)) +
  geom_area(fill = rgb(0, 0.5, 1, alpha = 0.5)) +
  labs(tag = "Fig. 1") +
  theme(plot.tag.position = "bottomright)
Further styles and adjustments
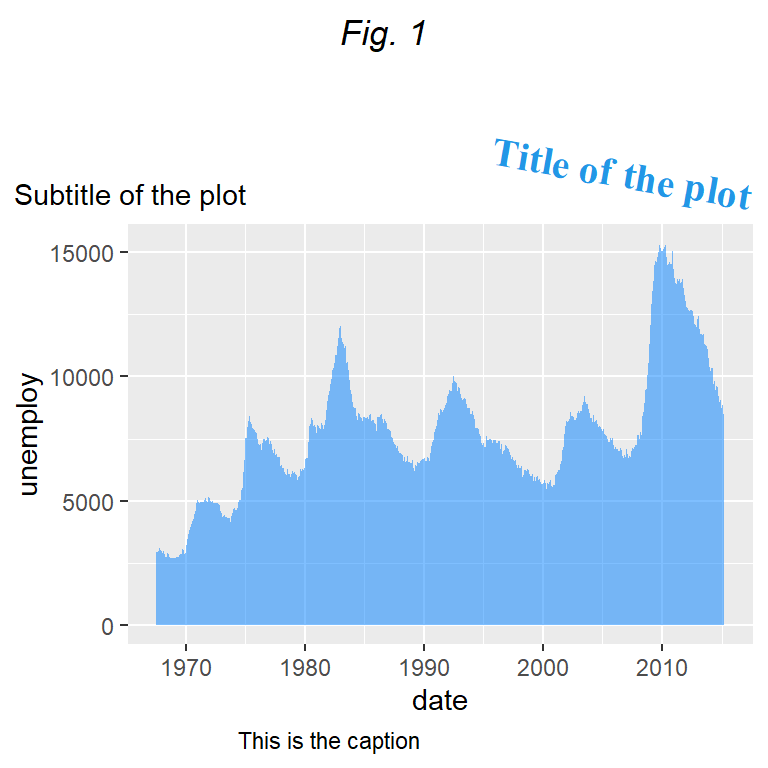
The titles, subtitles, captions and tags can be customized with the plot.title, plot.subtitle, plot.caption and plot.tag components of the theme function, making use of element_text. You can modify the color, the font family, the text size, the text face, the angle or the vertical and horizontal adjustment for each text as in the example below.
# install.packages(ggplot2)
library(ggplot2)

ggplot(economics, aes(date, unemploy)) +
  geom_area(fill = rgb(0, 0.5, 1, alpha = 0.5)) +
  labs(title = "Title of the plot",
       subtitle = "Subtitle of the plot",
       caption = "This is the caption",
       tag = "Fig. 1") +
  theme(plot.title = element_text(family = "serif",              # Font family
                                  face = "bold",                 # Font face
                                  color = 4,                     # Font color
                                  size = 15,                     # Font size
                                  hjust = 1,                     # Horizontal adjustment
                                  vjust = 1,                     # Vertical adjustment
                                  angle = -10,                   # Font angle
                                  lineheight = 1,                # Line spacing
                                  margin = margin(20, 0, 0, 0)), # Margins (t, r, b, l)
        plot.subtitle = element_text(hjust = 0),    # Subtitle customization
        plot.caption = element_text(hjust = 0.25),  # Caption customization
        plot.tag = element_text(face = "italic"),   # Tag customization
        plot.title.position = "plot",               # Title and subtitle position ("plot" or "panel")
        plot.caption.position = "panel",            # Caption position ("plot" or "panel")
        plot.tag.position = "top")                  # Tag position
Master Statistics
Learn statistics from the basics to advanced techniques, clearly explained
Go to site