The margins of the plots made with ggplot2 will adjust automatically to new layers, e.g. if you add a title. We have added a black box around the sample plot so you can see how margins change.
library(ggplot2)

ggplot() +
  stat_function(fun = dnorm, geom = "density",
                xlim = c(-4, 4),
                fill = rgb(0, 0, 1, 0.1)) +
  theme(plot.background = element_rect(color = 1,
                                       size = 1))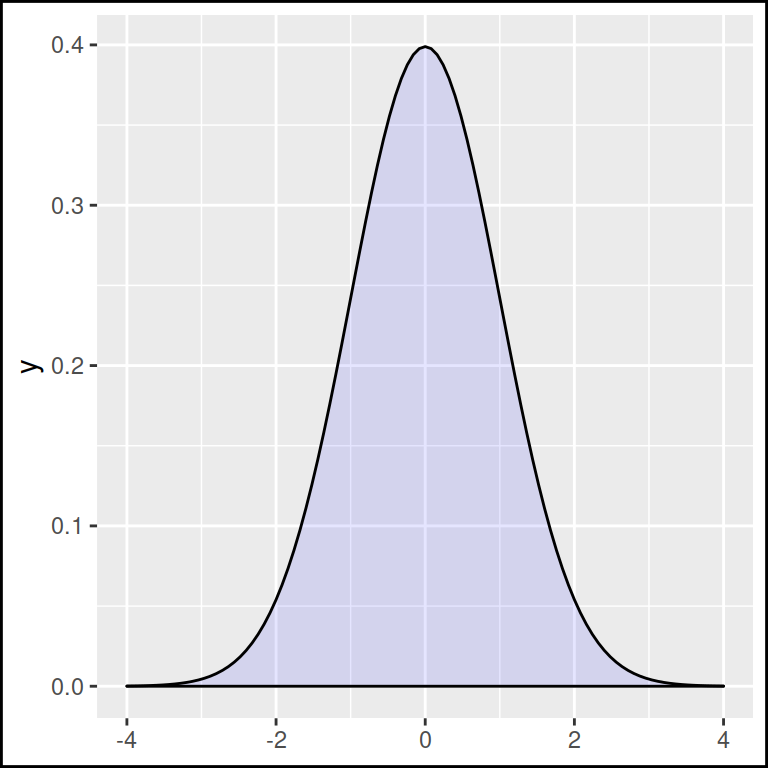
Increase margins
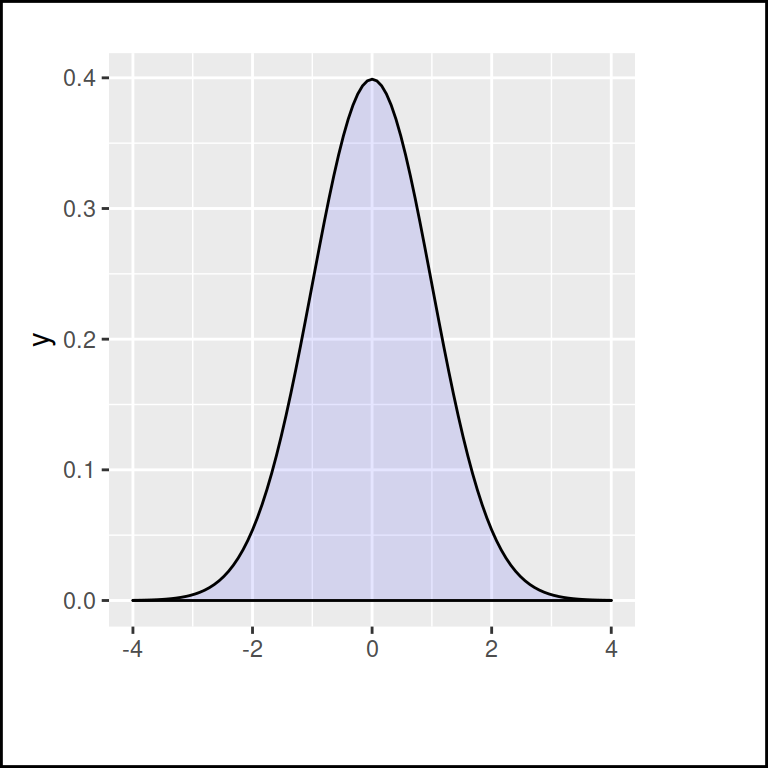
In order to modify the plot margins set the margin function inside the plot.margin component of the theme function.
library(ggplot2)

ggplot() +
  stat_function(fun = dnorm, geom = "density",
                xlim = c(-4, 4),
                fill = rgb(0, 0, 1, 0.1)) +
  theme(plot.background = element_rect(color = 1,
                                       size = 1),
        plot.margin = margin(t = 20,  # Top margin
                             r = 50,  # Right margin
                             b = 40,  # Bottom margin
                             l = 10)) # Left margin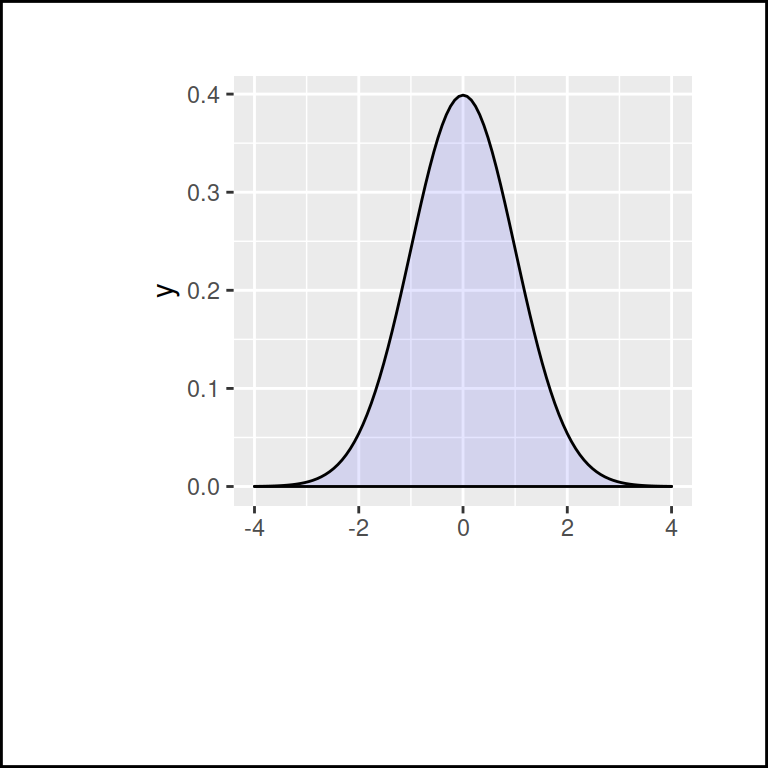
The margins are measured with points ("pt"), but you can use other unit measure in the unit argument, like centimeters. Type ?unit to see all the possible measures.
library(ggplot2)

ggplot() +
  stat_function(fun = dnorm, geom = "density",
                xlim = c(-4, 4),
                fill = rgb(0, 0, 1, 0.1)) +
  theme(plot.background = element_rect(color = 1,
                                       size = 1),
        plot.margin = margin(t = 1,  # Top margin
                             r = 1,  # Right margin
                             b = 3,  # Bottom margin
                             l = 2,  # Left margin
                             unit = "cm"))
Remove margins
To remove the margins set all values to 0. Note that there is still space to fit all the elements of the plot. You can set negative values to reduce more the margins.
library(ggplot2)

ggplot() +
  stat_function(fun = dnorm, geom = "density",
                xlim = c(-4, 4),
                fill = rgb(0, 0, 1, 0.1)) +
  theme(plot.background = element_rect(color = 1,
                                       size = 1),
        plot.margin = margin(t = 0,  # Top margin
                             r = 0,  # Right margin
                             b = 0,  # Bottom margin
                             l = 0)) # Left margin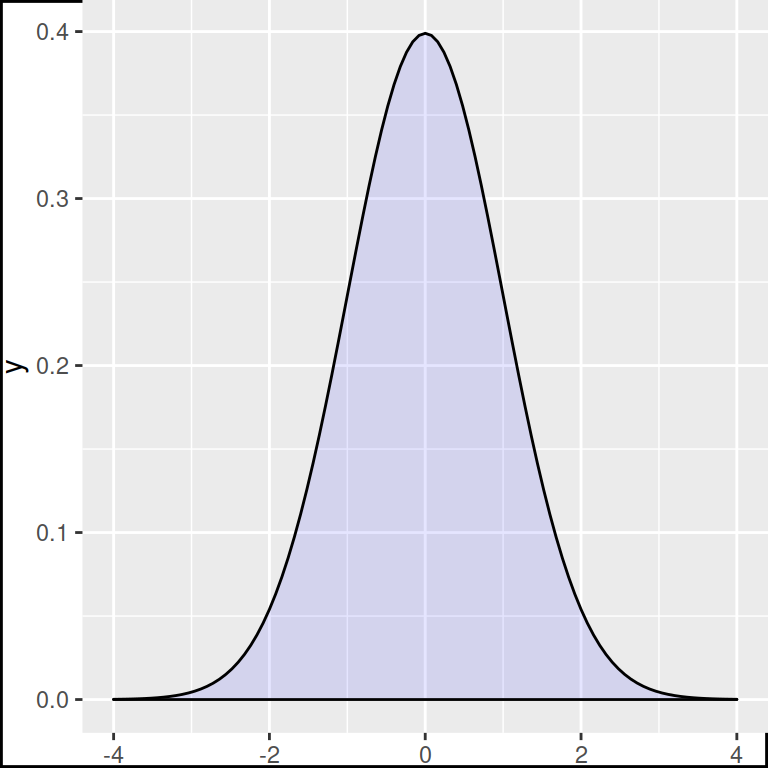
You can remember the order of the arguments of the margin function (t, r, b, l) remembering the word trouble.

Master Statistics
Learn statistics from the basics to advanced techniques, clearly explained
Go to site