By default, ggplot2 creates a major and a minor white grid as shown in the following figure.
library(ggplot2)
ggplot(data = mtcars, aes(x = hp, y = mpg))+
  geom_point()
Grid customization
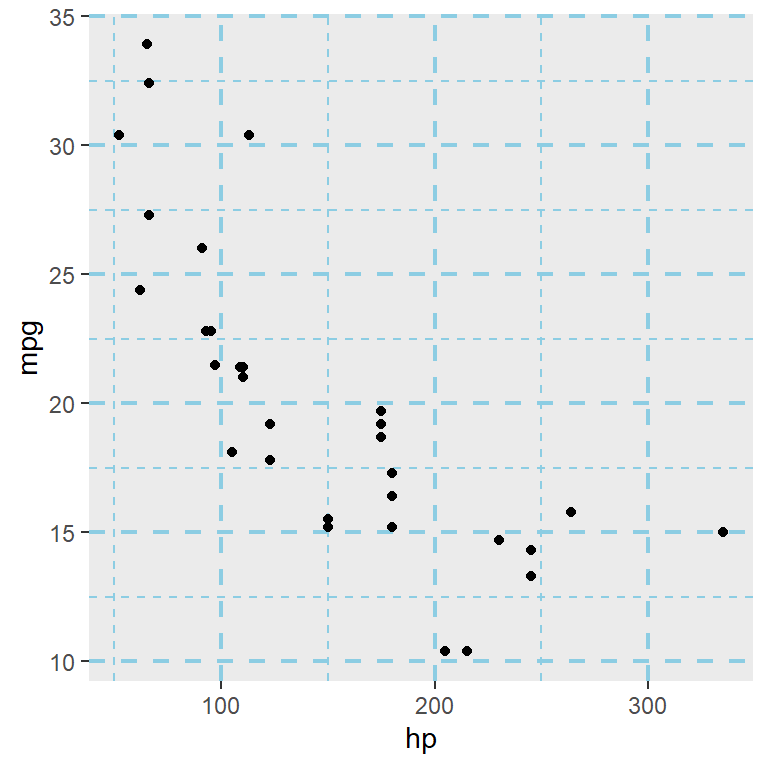
The grid aesthetics can be set with the panel.grid component of the theme function. Customize the color, line width and line type with the arguments of the element_line function.
library(ggplot2)

ggplot(data = mtcars, aes(x = hp, y = mpg)) +
  geom_point() +
  theme(panel.grid = element_line(color = "#8ccde3",
                                  size = 0.75,
                                  linetype = 2))
You can also customize the major grid and the minor grid individually, as shown in the following sections.
Major grid
The panel.grid.major allows you to customize the major grid of the panel.
library(ggplot2)

ggplot(data = mtcars, aes(x = hp, y = mpg)) +
  geom_point() +
  theme(panel.grid.major = element_line(color = "red",
                                        size = 0.5,
                                        linetype = 2))
Appending .x or .y to the previous component will allow customizing the vertical and horizontal lines of the major grid.
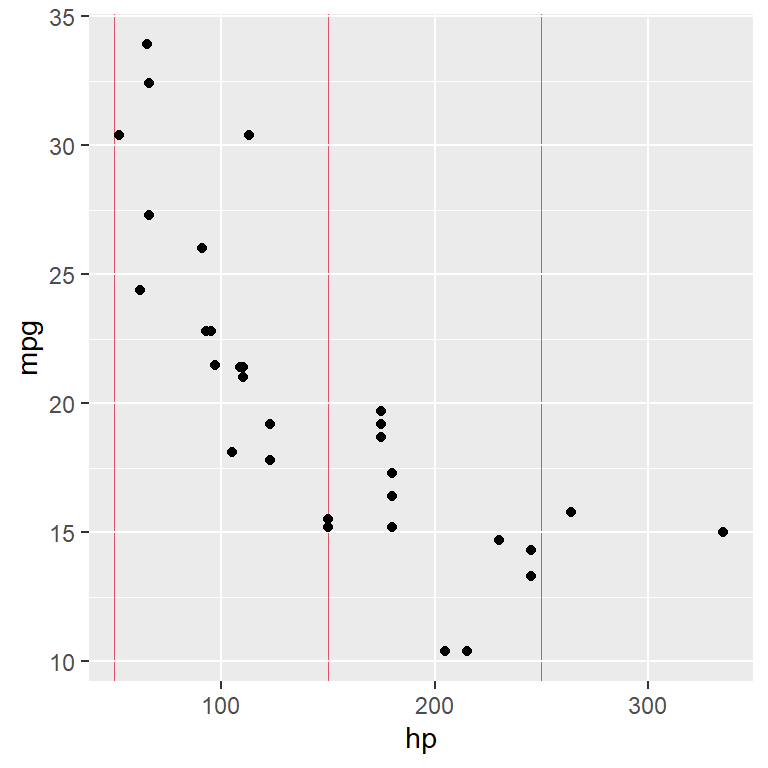
Vertical lines of the major grid
library(ggplot2)

ggplot(data = mtcars, aes(x = hp, y = mpg)) +
  geom_point() +
  theme(panel.grid.major.x = element_line(color = "red",
                                          size = 0.5,
                                          linetype = 2))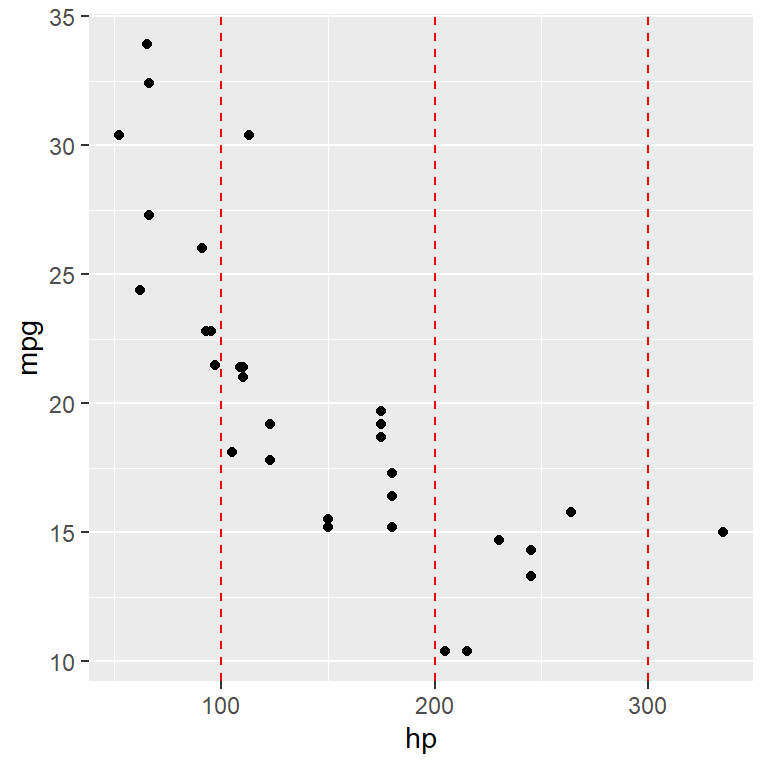
Horizontal lines of the major grid
library(ggplot2)

ggplot(data = mtcars, aes(x = hp, y = mpg)) +
  geom_point() +
  theme(panel.grid.major.y = element_line(color = "red",
                                          size = 0.5,
                                          linetype = 2))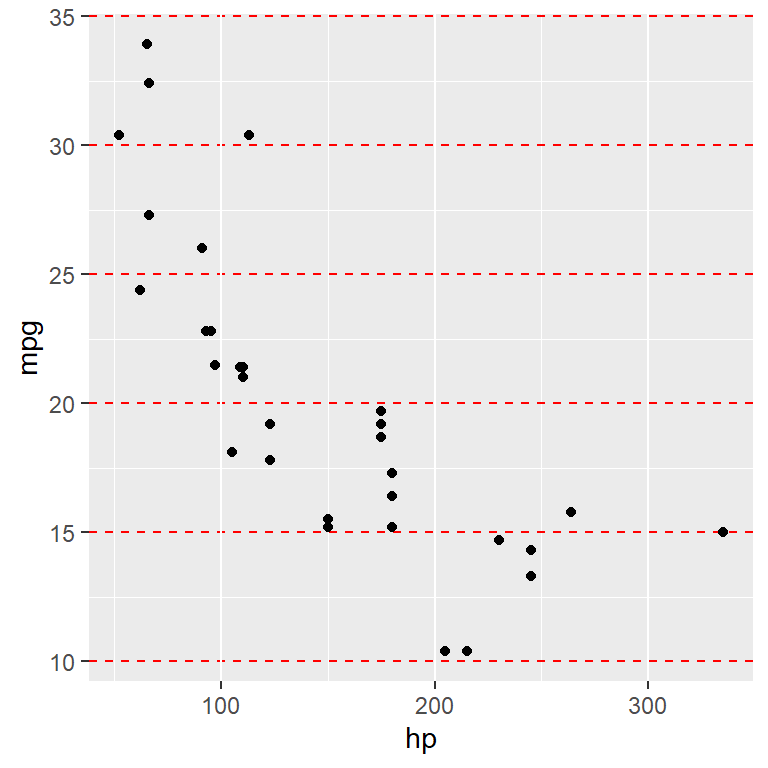
Minor grid
The panel.grid.minor allows you to customize the minor grid of the panel.
library(ggplot2)

ggplot(data = mtcars, aes(x = hp, y = mpg)) +
  geom_point() +
  theme(panel.grid.minor = element_line(color = 2,
                                        size = 0.25,
                                        linetype = 1))
As in the previous section, you can append .x or .y to the theme element.
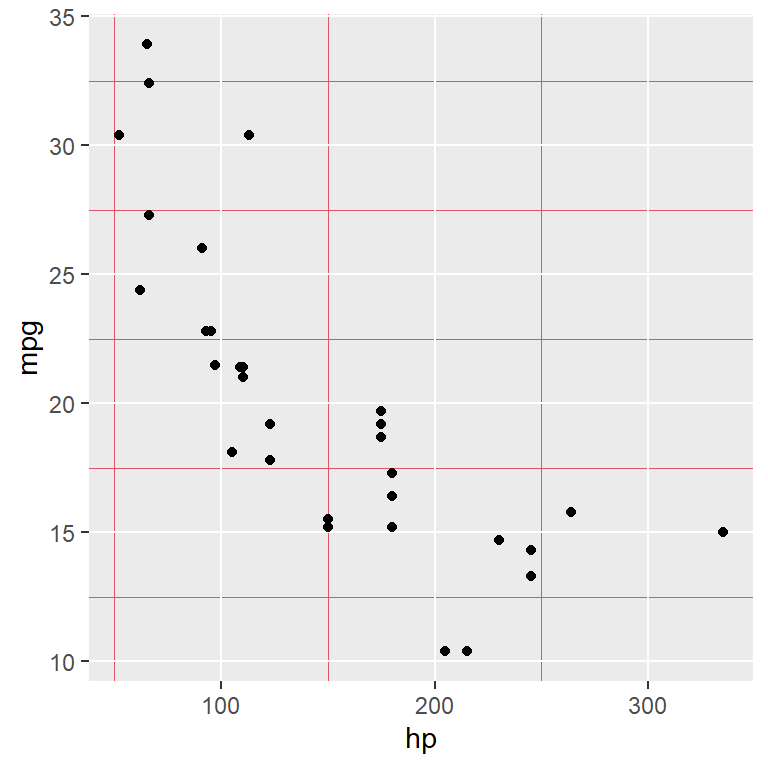
Vertical lines of the minor grid
library(ggplot2)

ggplot(data = mtcars, aes(x = hp, y = mpg)) +
  geom_point() +
  theme(panel.grid.minor.x = element_line(color = 2,
                                          size = 0.25,
                                          linetype = 1))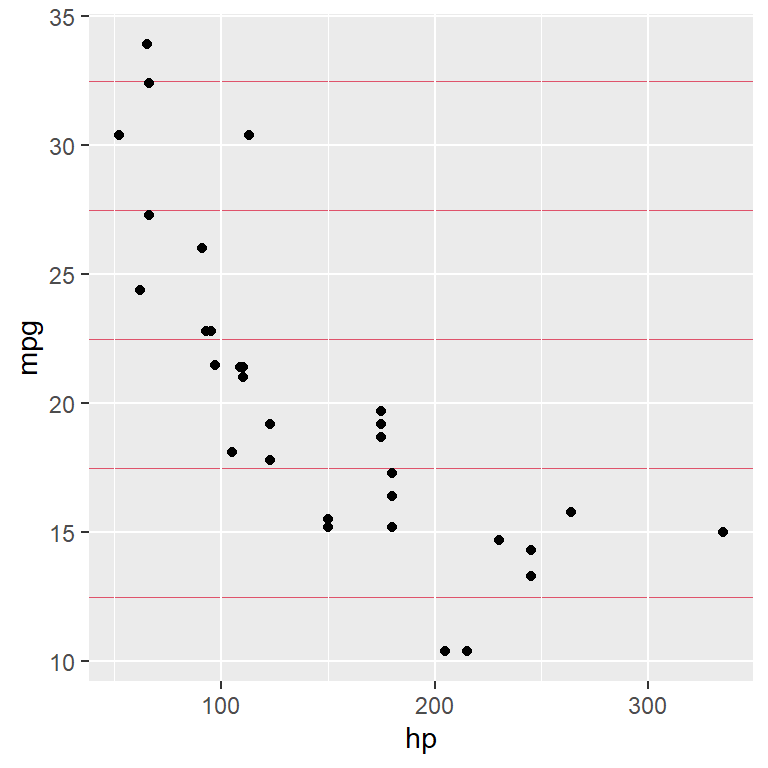
Horizontal lines of the minor grid
library(ggplot2)

ggplot(data = mtcars, aes(x = hp, y = mpg)) +
  geom_point() +
  theme(panel.grid.minor.y = element_line(color = 2,
                                          size = 0.25,
                                          linetype = 1))
Custom grid breaks
The number of grid breaks can be customized in ggplot for each axis with the breaks argument of the scale_(x|y)_continuous or scale_(x|y)_discrete functions, depending on if the variable of the (x|y)-axis is continuous or discrete.
In this example you can customize the breaks of the Y-axis with the scale_y_continuous function as follows.
library(ggplot2)

ggplot(data = mtcars, aes(x = hp, y = mpg)) +
  geom_point() +
  scale_y_continuous(breaks = seq(10, 35, by = 1))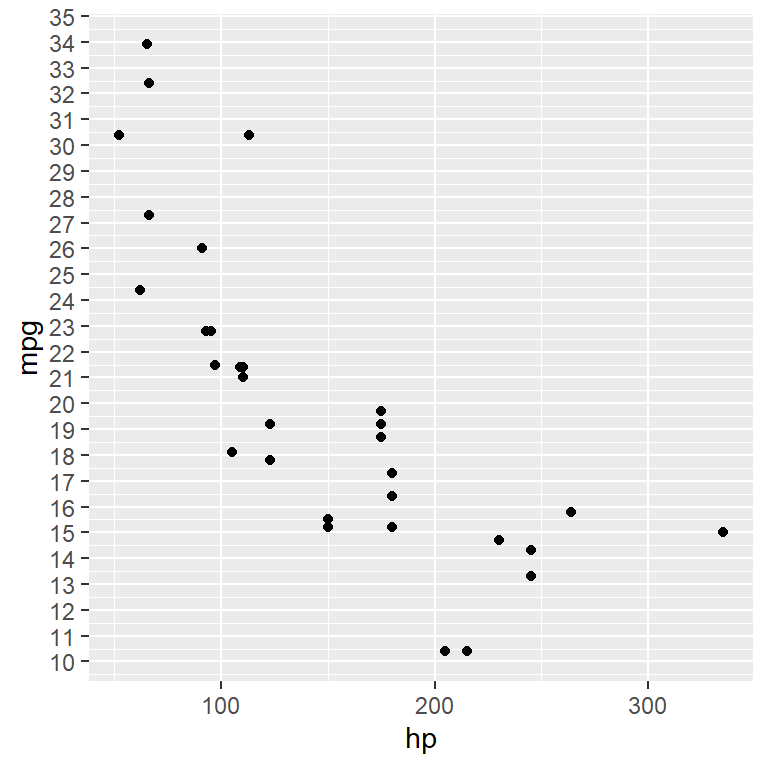
As the X-axis is also continuous you can make use of the scale_x_continuous to customize the grid breaks of the X-axis.
library(ggplot2)

ggplot(data = mtcars, aes(x = hp, y = mpg)) +
  geom_point() +
  scale_x_continuous(breaks = seq(50, 350, by = 25))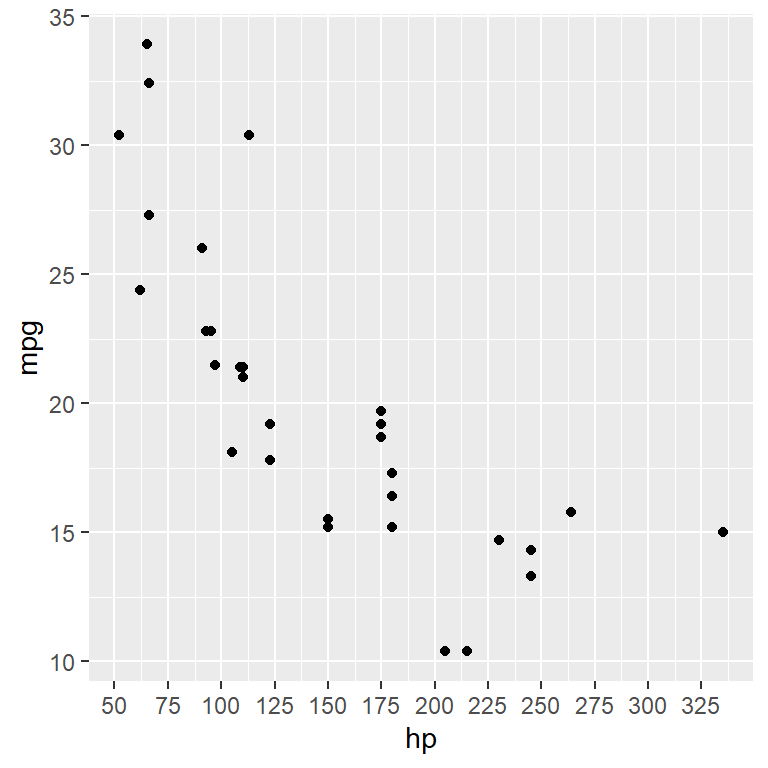
Set minor breaks with minor_breaks argument.
library(ggplot2)

ggplot(data = mtcars, aes(x = hp, y = mpg)) +
  geom_point() +
  scale_x_continuous(breaks = seq(50, 350, by = 25),
                     minor_breaks = seq(50, 350, 10))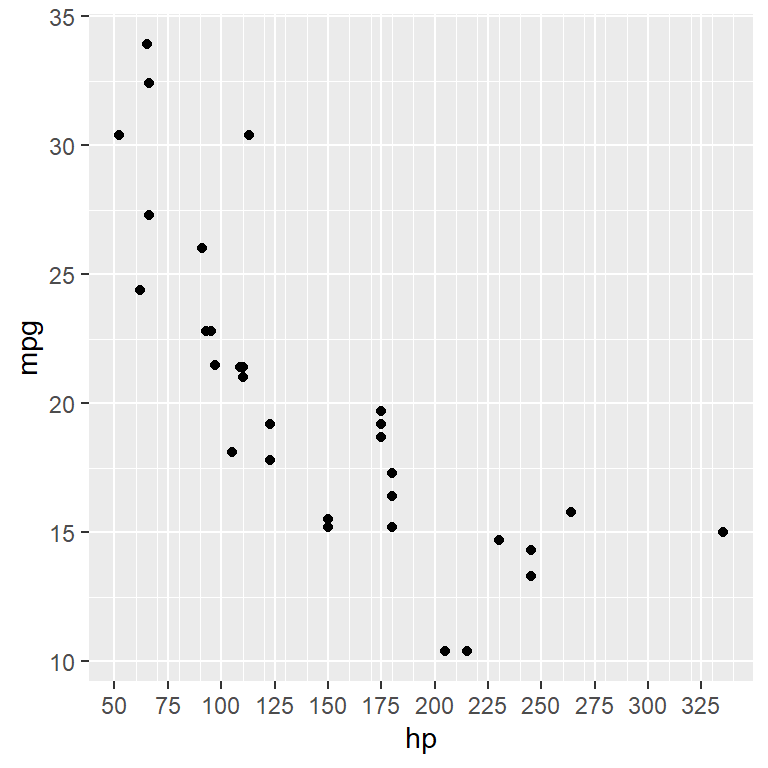
Set the number of major breaks with n.breaks argument.
library(ggplot2)
ggplot(data = mtcars, aes(x = hp, y = mpg)) +
geom_point() +
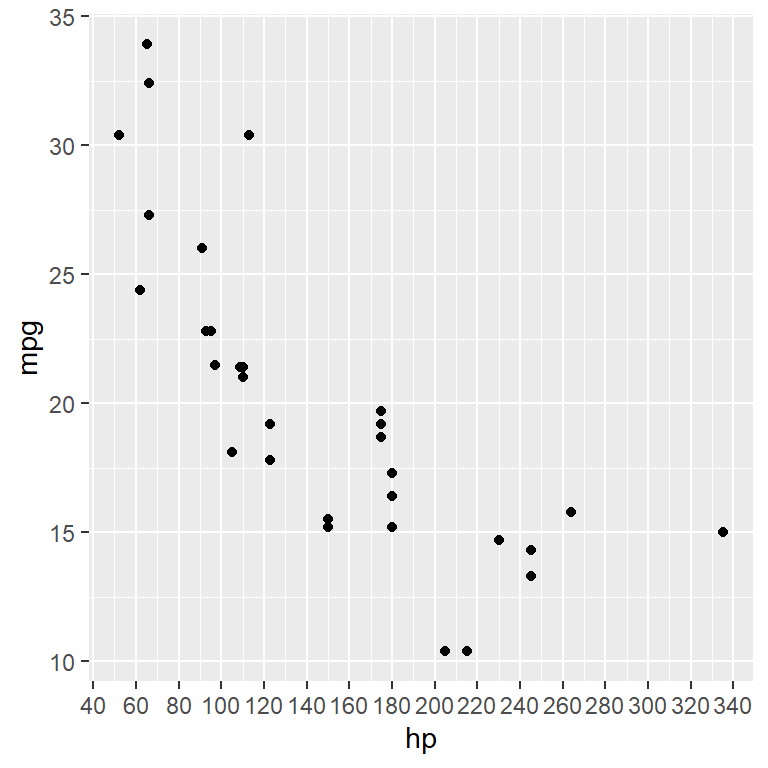
scale_x_continuous(n.breaks = 20)The algorithm behind the generation of major breaks may choose a different number than the specified to ensure nice break labels.
Remove grids
The same way you customized each grid (panel.grid, panel.major, panel.major.x, panel.major.y, panel.minor, panel.minor.x, panel.minor.y) you can remove them but setting element_blank instead of element_line.

Remove all grids
library(ggplot2)

ggplot(data = mtcars, aes(x = hp, y = mpg)) +
  geom_point() +
  theme(panel.grid = element_blank())
Remove the major grid
library(ggplot2)

ggplot(data = mtcars, aes(x = hp, y = mpg)) +
  geom_point() +
  theme(panel.grid.major = element_blank())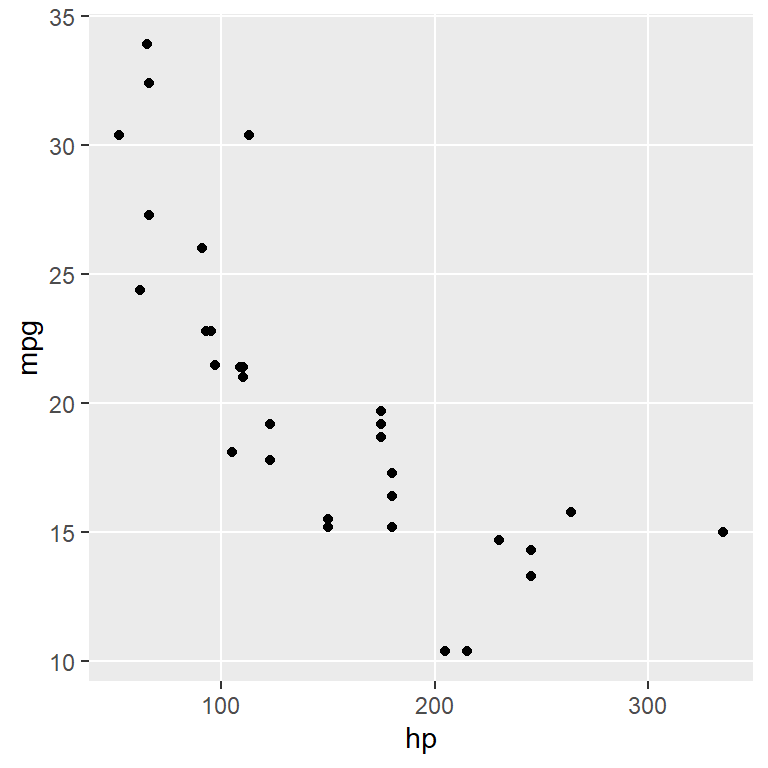
Remove the minor grid
library(ggplot2)

ggplot(data = mtcars, aes(x = hp, y = mpg)) +
  geom_point() +
  theme(panel.grid.minor = element_blank())
Master Statistics
Learn statistics from the basics to advanced techniques, clearly explained
Go to site