Search for a graph

R CHARTS

  • Home
  • Base R
  • Base R

    Titles


    • Setting titles
    • title function
    • Adjust titles
    • Math expressions

    Texts


    • text function
    • Label points
    • mtext function
    • Adjust text

    Lines


    • abline function
    • segments function
    • arrows function
    • Line types and styles

    Axes


    • Labels
    • axis function
    • Ticks
    • Limits
    • Scale
    • Dual axis

    Legend


    • Position
    • Orientation
    • Title
    • Colors
    • Size
    • Legend outside

    Other


    • Background color
    • pch symbols
    • Grids
    • Box types
    • Margins
    • Combining plots

    Quick guides

    pch symbols
    R margins
    Outer margins
    Line types
    Line widths

    See all base R charts

  • ggplot2
  • ggplot2

    Axes


    • Axis titles
    • Labels
    • Ticks
    • Limits
    • Scales
    • Dual axis

    Legend


    • Legend title
    • Labels
    • Position
    • Customization
    • Remove the legend

    Texts


    • Title and subtitle
    • Caption and tag
    • geom_text
    • geom_label
    • ggrepel

    Colors and styles


    • Colors
    • Color palettes
    • Shapes
    • Line types
    • Lines and curves

    Themes


    • In-built themes
    • Theme packages
    • Background color
    • Grid
    • Margins

    Layout


    • facet_wrap
    • facet_grid
    • Combining plots
    • Coordinate systems

    Quick guides

    Shapes in ggplot2
    Line types in ggplot2
    Colors in ggplot2
    Legend position in ggplot2
    ggplot2 themes

    See all ggplot2 tutorials

  • colors
    COLORS COLOR PALETTES PALETTE GENERATOR
  • Resources
    PYTHON CHARTS R CODER R PACKAGES MASTER STATISTICS
  • About
  • Contact
  • Español

plotly

Twitter logo
LinkedIn logo
Facebook logo
Sankey diagram in plotly

Sankey diagram in plotly

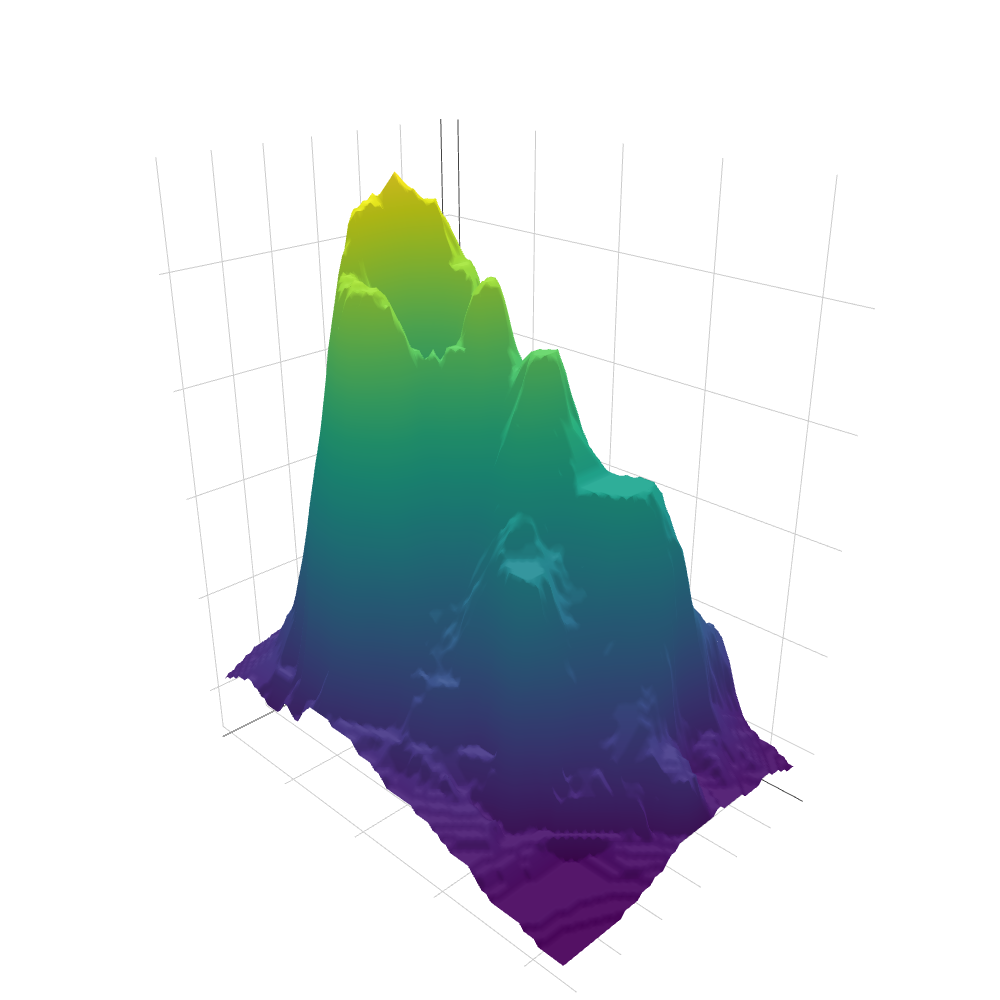
3D plots in R with plotly

3D plots in R with plotly

Interactive ggplot2 charts with ggplotly

Interactive ggplot2 charts with ggplotly

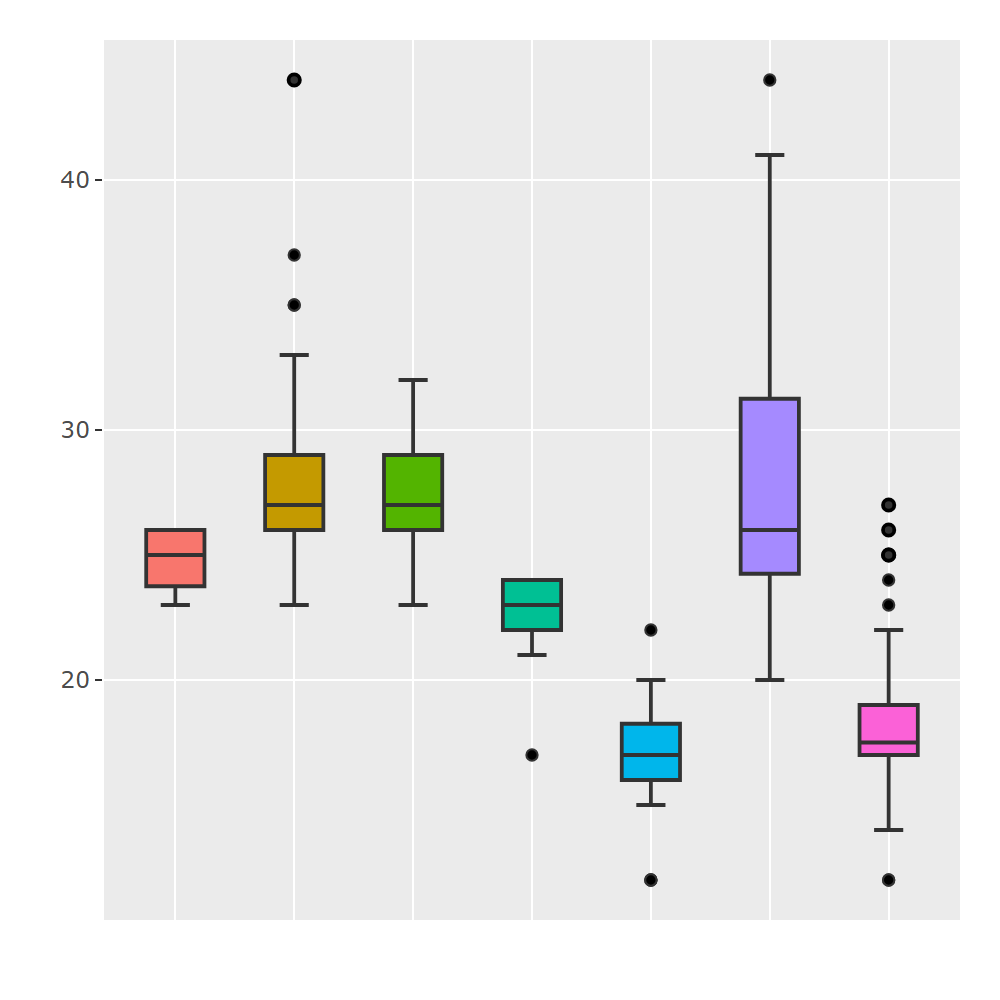
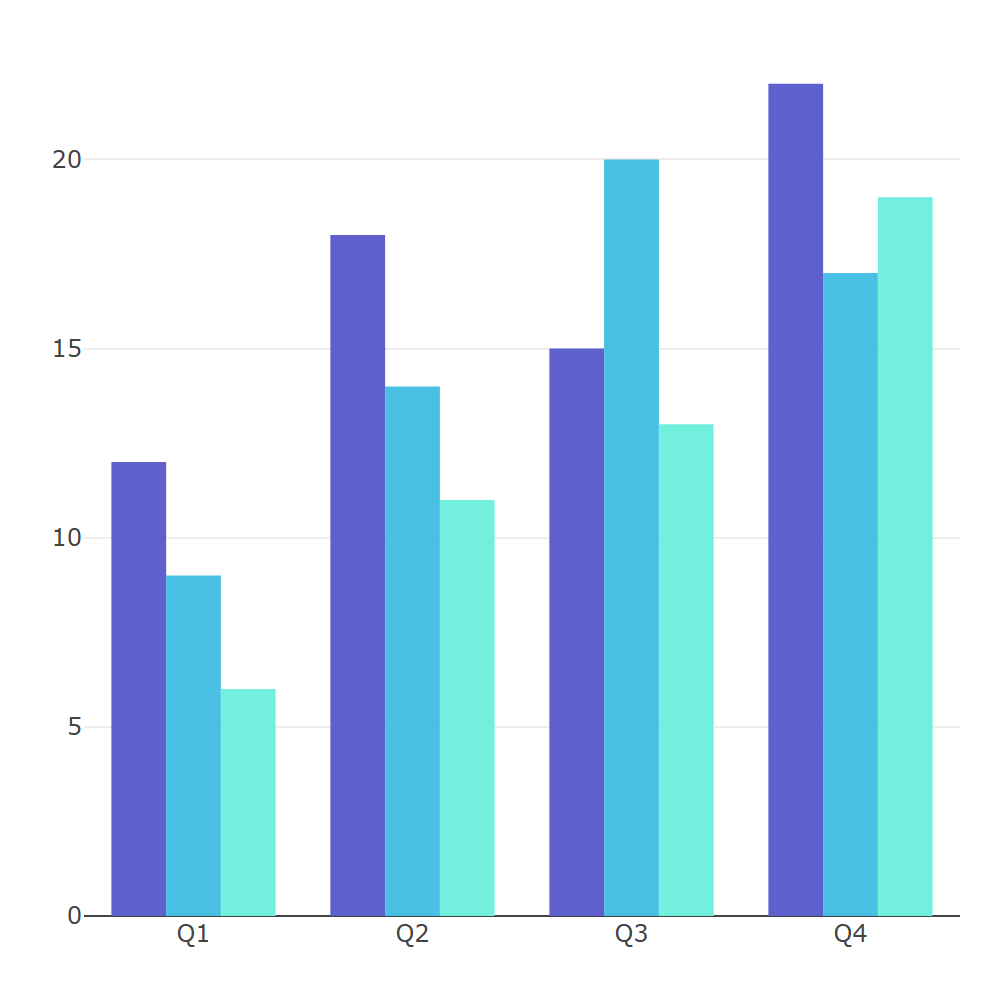
Interactive plots in R with plotly

Interactive plots in R with plotly

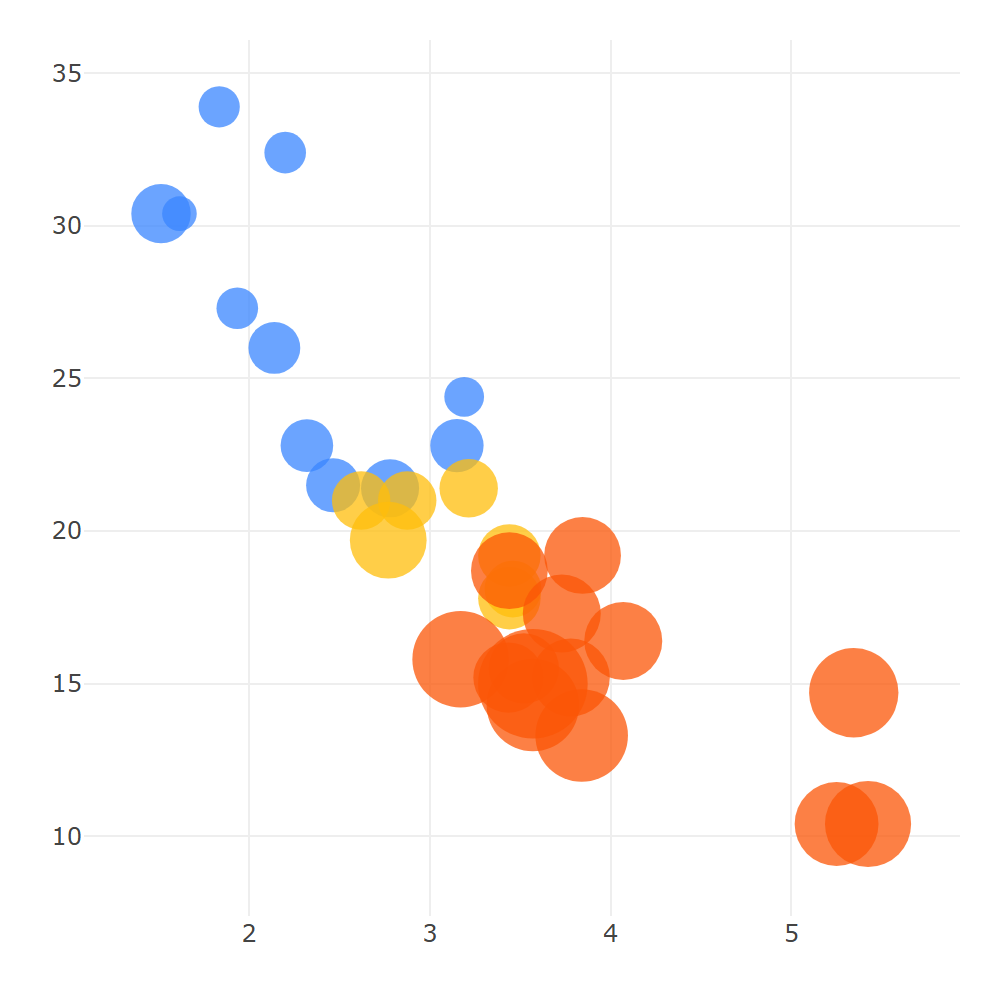
Scatter plot in plotly

Scatter plot in plotly

R CODER

Policies

Legal advice

Resources

Home

Base R

ggplot2

About

Tools

Colors

Color converter

Color palettes

Palette generator


R CHARTS by R CODER | © 2026