Sample data
In this tutorial we are going to use the mtcars data set, converting the number of cylinders (cyl) into a factor to use it as a grouping variable and storing the name of each car in a new column called model.
df <- mtcars
df$cyl <- factor(df$cyl)
df$model <- rownames(mtcars)
Interactive scatter plot
In order to create a scatter plot with plotly pass the variables to x and y and set type = "scatter" and mode = "markers". You can also use the add_markers function instead, which is equivalent. The chart allows zooming and hovering over the points to see their coordinates.
# install.packages("plotly")
library(plotly)

plot_ly(df, x = ~wt, y = ~mpg,
        type = "scatter", mode = "markers")
Scatter plot by group
Map a categorical variable to color to color the points by group and set the colors with colors. Each group will be added to the legend, so you can click on them to hide or show the groups. You can also map the variable to symbol to use a different shape for each group.
plot_ly(df, x = ~wt, y = ~mpg, color = ~cyl,
        colors = c("#3A86FF", "#FFBE0B", "#FB5607"),
        type = "scatter", mode = "markers")
Bubble chart
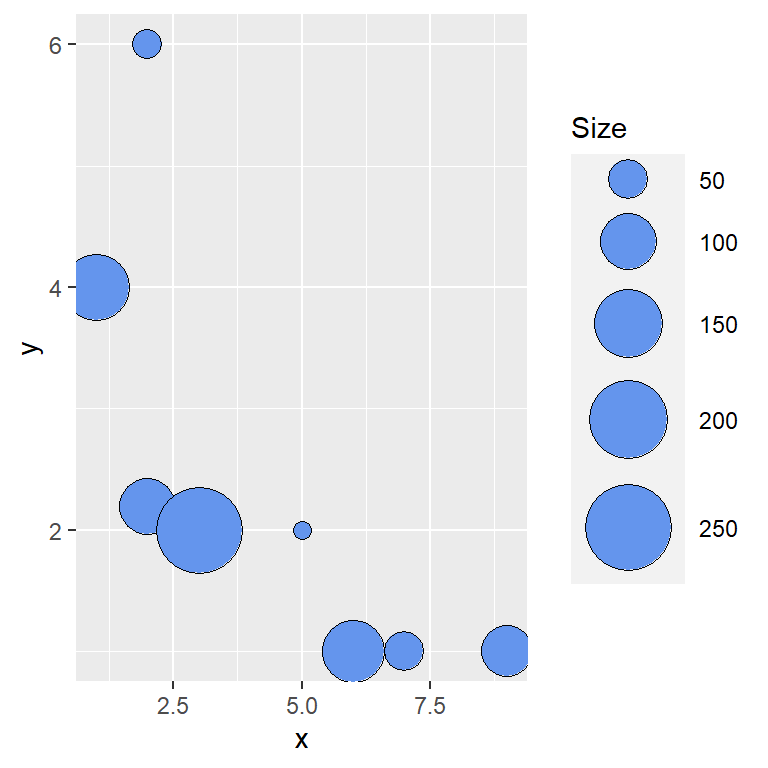
If you map a numerical variable to size the size of the points will depend on its values, creating a bubble chart. The minimum and maximum size of the bubbles can be set with sizes. In this example we are also adding transparency to the bubbles with opacity, as they overlap.
plot_ly(df, x = ~wt, y = ~mpg, color = ~cyl,
        size = ~hp, sizes = c(10, 50),
        marker = list(opacity = 0.6),
        type = "scatter", mode = "markers")
Marker style
The style of the points is customized passing a list to marker, which allows setting the size, the color, the shape with symbol (such as "circle", "square", "diamond" or "triangle-up") and the border of the markers with line.
plot_ly(df, x = ~wt, y = ~mpg,
        type = "scatter", mode = "markers",
        marker = list(size = 12, color = "#FFBE0B", symbol = "diamond",
                      line = list(color = "#3A86FF", width = 1.5)))
Hover text
Use text to pass additional information to the points and hovertemplate to customize the text displayed when hovering over them. In this example the box shows the name of the car along with the values of the axes, formatting the weight with two decimals with %{x:.2f}.
plot_ly(df, x = ~wt, y = ~mpg,
        type = "scatter", mode = "markers",
        text = ~model,
        hovertemplate = paste("<b>%{text}</b><br>",
                              "Weight: %{x:.2f}<br>",
                              "Miles per gallon: %{y}<extra></extra>"))
Regression line
plotly doesn’t compute regression lines, but you can fit a model with lm, compute the fitted values with fitted and add them to the chart with add_lines. The name argument sets the name of each trace in the legend.
fit <- lm(mpg ~ wt, data = df)

plot_ly(df, x = ~wt, y = ~mpg,
        type = "scatter", mode = "markers", name = "Data") |>
  add_lines(y = ~fitted(fit), name = "Regression line")
If you prefer ggplot2 you can create a scatter plot in ggplot2 and convert it into an interactive chart with ggplotly. Check the guide about interactive plots with plotly to learn how to customize the titles, the axes and the legend.
Master Statistics
Learn statistics from the basics to advanced techniques, clearly explained
Go to site