3D scatter plot
plotly allows creating interactive 3D plots in R, which can be rotated, zoomed and explored hovering over the elements. In this tutorial you will learn how to create 3D scatter plots and surface plots.
In order to create a 3D scatter plot pass three variables to x, y and z and set type = "scatter3d" and mode = "markers". In the following example we are using three variables of the iris data set. Drag the plot to rotate it.
# install.packages("plotly")
library(plotly)

plot_ly(iris, x = ~Sepal.Length, y = ~Sepal.Width,
        z = ~Petal.Length,
        type = "scatter3d", mode = "markers")
3D scatter plot by group
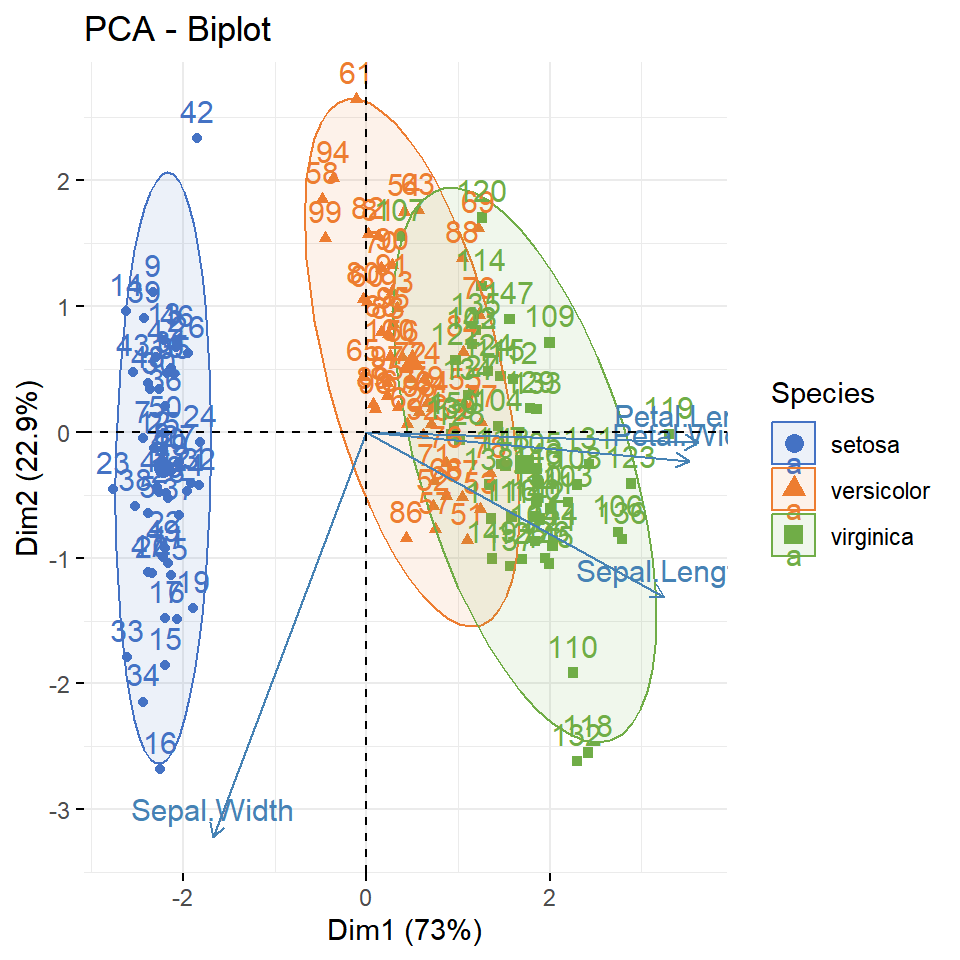
As in other plotly charts you can color the points by group mapping a variable to color and setting the colors with colors. Note that in 3D plots the points are big by default, so you may want to reduce their size with marker = list(size = ...).
plot_ly(iris, x = ~Sepal.Length, y = ~Sepal.Width,
        z = ~Petal.Length, color = ~Species,
        colors = c("#7B2CBF", "#F72585", "#4CC9F0"),
        marker = list(size = 4),
        type = "scatter3d", mode = "markers")
Axis titles
The axes of 3D plots are customized inside the scene argument of layout, passing lists to xaxis, yaxis and zaxis. In this example we are changing the titles of the three axes.
plot_ly(iris, x = ~Sepal.Length, y = ~Sepal.Width,
        z = ~Petal.Length, color = ~Species,
        marker = list(size = 4),
        type = "scatter3d", mode = "markers") |>
  layout(scene = list(xaxis = list(title = "Sepal length"),
                      yaxis = list(title = "Sepal width"),
                      zaxis = list(title = "Petal length")))
Surface plot
Surface plots display a variable over a grid and are created from a matrix, where the values are the heights (z) and the rows and columns are the positions of the grid. Pass the matrix to z and use the add_surface function. In this example we are using the volcano matrix, which contains the topography of a volcano.
plot_ly(z = ~volcano) |>
  add_surface()
Colorscale and contours
The colors of the surface can be changed with the colorscale argument, which accepts the name of a palette, such as "Viridis", "Blues" or "Earth". In addition, you can project the contour lines of the surface over the base of the plot with contours.
plot_ly(z = ~volcano) |>
  add_surface(colorscale = "Viridis",
              contours = list(z = list(show = TRUE,
                                       usecolormap = TRUE,
                                       project = list(z = TRUE))))
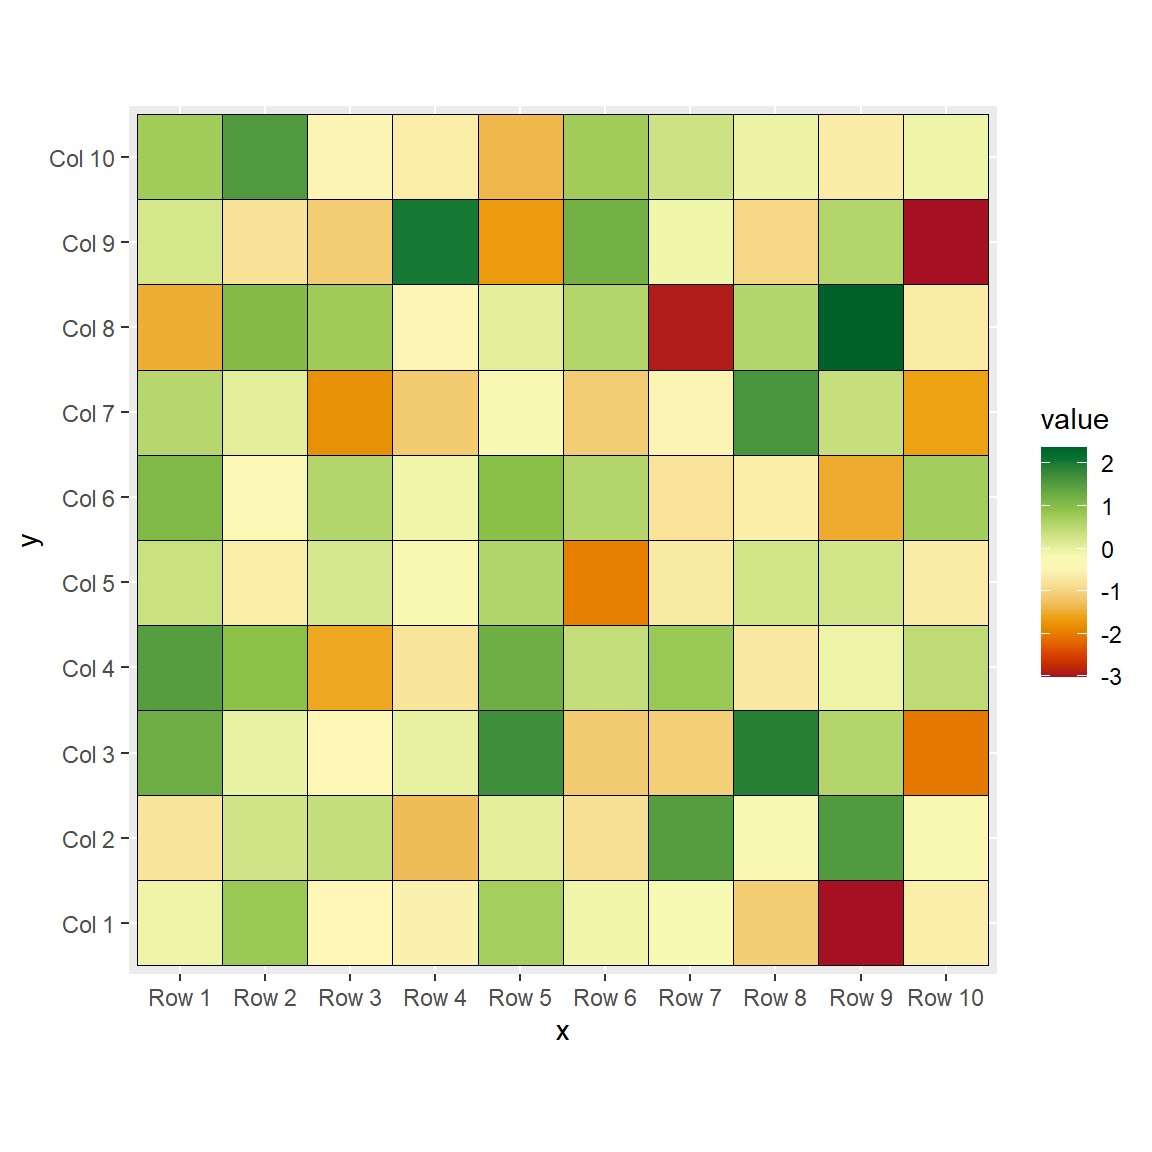
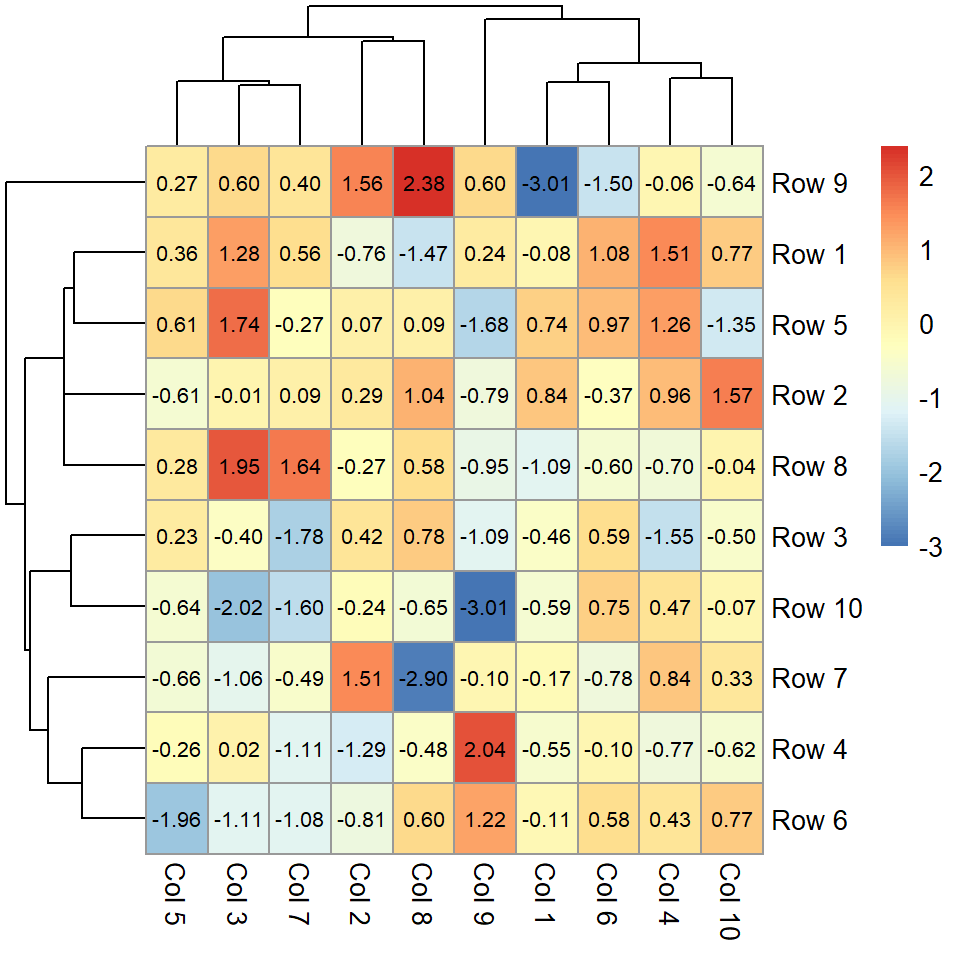
If you need a 2D representation of the same data you can create a contour plot or a heat map. Check the guide about interactive plots with plotly to learn how to customize the hover text, the legend and the toolbar.
Master Statistics
Learn statistics from the basics to advanced techniques, clearly explained
Go to site