Sample data
The visNetwork package allows creating interactive network graphs in R based on the vis.js JavaScript library. You can zoom, drag the nodes and select them to see their connections.
visNetwork requires two data frames: one with the nodes, which must contain a column named id, and another with the edges, with the columns from and to, containing the ids of the connected nodes. Other columns, such as label or group, will be used to customize the graph.
In this tutorial we are going to use a small network with the relationships between the employees of a company, which belong to three departments.
nodes <- data.frame(id = 1:12,
                    label = c("Ana", "Ben", "Carla", "David", "Eva", "Frank",
                              "Grace", "Hugo", "Iris", "Jack", "Kate", "Leo"),
                    group = rep(c("Marketing", "Sales", "IT"), each = 4))

edges <- data.frame(from = c(1, 1, 1, 2, 3, 5, 5, 6, 7, 9, 9, 10, 11, 4, 8, 12),
                    to   = c(2, 3, 4, 3, 4, 6, 7, 8, 8, 10, 11, 12, 12, 5, 9, 1))
The visNetwork function
Pass the nodes and the edges to the visNetwork function to create the network. As the data frame of the nodes contains a group column the nodes will be colored by group automatically. Drag the nodes or use the mouse wheel to zoom.
# install.packages("visNetwork")
library(visNetwork)

visNetwork(nodes, edges)
Note that the position of the nodes is computed with a physics simulation, so it will change each time you create the graph. Use visLayout(randomSeed = ...) to always get the same layout.
Groups and legend
The style of each group can be customized with the visGroups function, passing the name of the group to groupname and the options, such as the color or the shape. Use visLegend to add a legend with the groups.
visNetwork(nodes, edges) |>
  visGroups(groupname = "Marketing", color = "#E07A5F") |>
  visGroups(groupname = "Sales", color = "#3D405B") |>
  visGroups(groupname = "IT", color = "#81B29A") |>
  visLegend() |>
  visLayout(randomSeed = 4)
Shape and size of the nodes
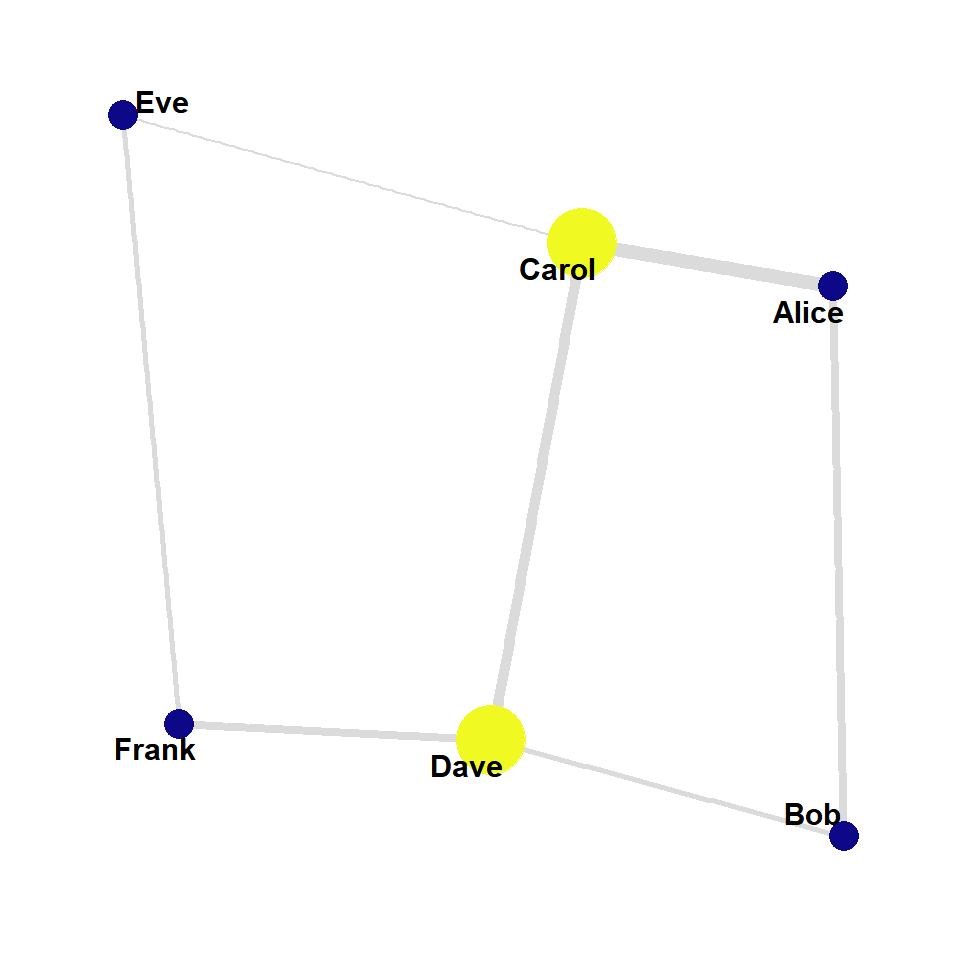
The visNodes function sets the style of all the nodes, such as the shape ("dot", "square", "triangle", "star", "box" or "ellipse", among others) and the size. If you add a column named value to the nodes their size will depend on it. In this example the size depends on the number of connections of each node.
nodes$value <- as.numeric(table(factor(c(edges$from, edges$to),
                                       levels = nodes$id)))

visNetwork(nodes, edges) |>
  visNodes(shape = "dot") |>
  visLayout(randomSeed = 4)
Edges
The edges are customized with the visEdges function. Use arrows = "to" to create a directed network, color to set the color of the edges and the color they get when selecting a node, and smooth = FALSE to draw straight lines. You can also add a width column to the edges to set their width.
visNetwork(nodes, edges) |>
  visNodes(shape = "dot") |>
  visEdges(arrows = "to", color = list(color = "gray", highlight = "#E07A5F"),
           smooth = FALSE) |>
  visLayout(randomSeed = 4)
Highlight and select nodes
The visOptions function adds interactivity to the network. highlightNearest = TRUE highlights the nodes connected to the selected node, nodesIdSelection = TRUE adds a dropdown menu to select a node and selectedBy adds another menu to select all the nodes of a group.
visNetwork(nodes, edges) |>
  visNodes(shape = "dot") |>
  visOptions(highlightNearest = TRUE,
             nodesIdSelection = TRUE,
             selectedBy = "group") |>
  visLayout(randomSeed = 4)
Layout
If you have the igraph package installed you can use its layouts with the visIgraphLayout function, which also makes large networks faster, as the positions are computed before drawing the graph. In this example we are placing the nodes in a circle with "layout_in_circle". Other options are "layout_nicely", "layout_with_fr" or "layout_as_tree".
visNetwork(nodes, edges) |>
  visNodes(shape = "dot") |>
  visIgraphLayout(layout = "layout_in_circle")
Finally, you can save the network as an HTML file with visSave. If you prefer static network graphs made with ggplot2 check the ggraph package. You can also create interactive charts with plotly.
network <- visNetwork(nodes, edges)
visSave(network, file = "network.html")
Master Statistics
Learn statistics from the basics to advanced techniques, clearly explained
Go to site